Quick introduction to ArangoDB, the multi-model database
Oct 31, 2023 by Cylab Researcher | 2685 views
https://cylab.be/blog/298/quick-introduction-to-arangodb-the-multi-model-database
You have heard of RDBMS, for Relational Database Management System, or may even intuitively associate the word “database” with a tabular representation of data that you can query using a language such as SQL. Depending on your technical affinity, or the scale of your problem, you would then turn to your tool of choice to store and access your data in a CSV text file, a spreadsheet, … or table(s) inside a proper database. Ouch! Who says that one of those is better than another? And why even learn about anything else than a tabular model?
Anything can be a database …
It comes down to how to best model the elements that make up your problem and their interaction. Surely your mental model when grocery shopping is a one-dimensional bullet point list. Whether it fills up multiple columns on a Post-It note is irrelevant; the point remains that you store all grocery items in some data container under a single title, such as Stuff to buy.
… but some things are better databases than others
When it comes to data persistence, paper notes have a tendency to vanish without warning. The same goes for text files or spreadsheets. This is when proper database systems come in handy; adding back-ups, storage and query optimization, automatic checks of data consistency (all phone numbers with a prefix, names only in lower case, …), and many more. But now we are back to the initial question of tabular or not, RDBMS and SQL or not?
Imagine that you want to keep track of any of the following:
- scientific articles you read while writing up your thesis
- researchers you met at various conferences
- the latest companies that fell prey to a cyber attack by your favourite APT
- the most popular opinions on social media about some world events
You might create tables having columns such as: title, author, organizer, APT_name, opinion_category, number_of_likes, short_description, date, personal_comments, … You will then fix these attributes or column names along with their data type (e.g. integers, strings, arrays) into the so-called schema of (several tables in) your database. Once defined, this data model is rigid and is not meant to be changed at every step of your project. Obviously it is always possible to copy or recreate your tables with different columns; SQL-based databases can thus evolve within reasonable limits. Plenty more reasons can explain why RDBMS have been around for half a century. But what about your mental model?
When relational databases overlook relations
It is a bit of misnomer to refer to relational databases when, in fact, they do not track the relations between entities. For instance, take 5 seconds for each of the problems below, and imagine how you would explain your approach to your parents, to a colleague or in your draft notebook:
- detect the scientific articles or conference researchers that are related to you via one or two specific organization(s)
- determine the degree of separation between the most hacked companies and certain APTs
- identify the social media users that most effectively act as bridges between given conspiracy echo chambers — i.e. they might have unremarkable scores of likes, number of connections, … but are themselves connected with all the most popular individuals in each social media community
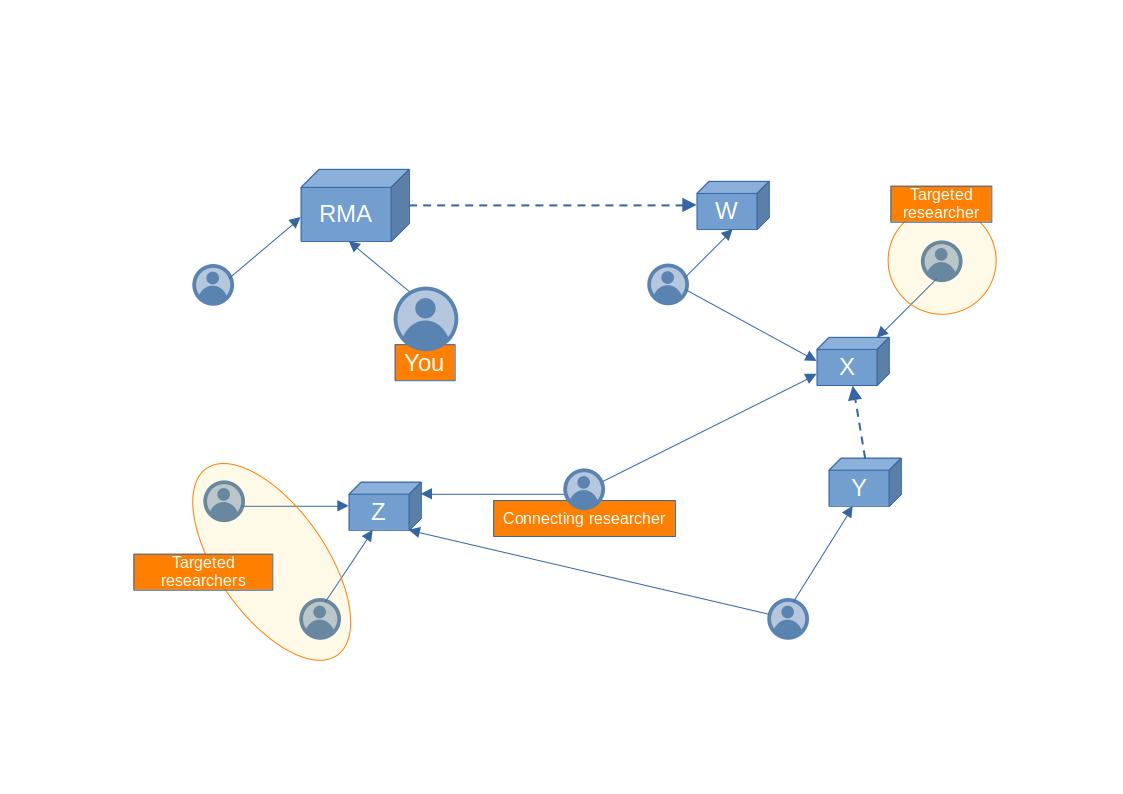
I dare think (hope) that the image that came to your mind for these problems did not include several mini-spreadsheets connected together. It would probably look more like the figure above. In this case the problem can be formulated like this: “identify that Connecting researcher who is a direct colleague of the three circled Targeted researchers, then work out the shortest path, i.e. the smallest list of researchers, between you and the Connecting researcher”. A query in SQL would require inefficiently joining multiple times the same tables, and the syntax would be cryptic to anyone but the developer. In a so-called graph database, the same query would look like this:
FOR [Any researcher]
STARTING FROM [Targeted researchers]
SEPARATED BY [2 steps]  # one for each vertex (researcher or organization) in the graph
RETURN [Connecting researcher]
COMPUTE SHORTEST PATH FROM [You] TO [Connecting researcher]
The code for this query is given below but, first, now is the time to introduce ArangoDB; a multi-model database. In practice, this means that it operates natively and simultaneously like a graph database such as neo4j, a document database à la MongoDB, a key-value store like redis and even a search engine such as elastic.
No schema, no tracas
Of course not, but that presents serious advantages. The databases mentioned in the previous paragraph are generically referred to as NoSQL. Irrespective of your preferred urban legend about this acronym ( 🤓 is it even an acronym? 😈 ), in short, they allow but do not impose the use of a schema. Despite that freedom, they have competitive performances. Thanks to that freedom, they can do things that RDBMS can´t.
For the problem above about the network of researchers and organizations, the code in AQL (working out this acronym is your homework for today) would be:
FOR researcher, connection, path
IN 2 ANY "list_of_researchers/targeted_researcher_x"   list_of_connections
FILTER IS_SAME_COLLECTION( "list_of_researchers", path.vertices[2] )
RETURN path.vertices[2].name
Do that with each of the Targeted researchers then find the Connecting researcher they all have in common. Next, for the shortest path between You and the Connecting researcher, the AQL code is:
FOR vertex, edge
IN ANY SHORTEST_PATH "list_of_researchers/you"
TO "list_of_researchers/connecting_researcher"   list_of_connections
FILTER IS_SAME_COLLECTION( "list_of_researchers", vertex )
RETURN vertex.name
Get to know ArangoDB
The equivalent in AQL of the RDBMS terminology of Tables and Records is Collections and Documents. Each data record in ArangoDB is actually a JSON document, a highly efficient and very human readable file format (the power of which is discussed in a subsequent blog post). Having all data stored in JSON in the background ensures interoperability with a wide range of existing software and programming languages.
It is easy to import or export data, for instance as JSON or CSV files, either manually through the web interface above, or programmatically via scripts in bash, zsh, python, … (a subsequent blog post will explain how to use the python driver).
ArangoDB is intuitive, flexible and powerful to use just as a schema-free data store. But in order to benefit from the power of graph algorithms, an additional collection type exists: the Edges. They can be used as a simple list of pairs of “_from: document_x” and “_to: document_y”. In this case, they inform AQL of where to look for paths during a graph traversal like in the problem above. But edges can have any number of attributes assigned to them, e.g.: the duration of an employment relationship, the distance in kilometres between two geographical points, the weight of a connection, … significantly increasing the possibilities of network analysis.
In the hope that this short introduction has piqued your interest in graph databases in general, and in ArangoDB in particular, more blog posts related to this theme will be published here.
This blog post is licensed under
CC BY-SA 4.0


