Collecting and processing NetFlow on Ubuntu
Oct 9, 2019 by Thibault Debatty | 23731 views
https://cylab.be/blog/42/collecting-and-processing-netflow-on-ubuntu
NetFlow is a feature that was introduced on Cisco routers around 1996 that provides the ability to collect and process network traffic summary.
At the opposite of full packet capture, only a summary of network traffic is collected. For NetFlow version 5, the collected fields are:
- Ingress interface
- Source IP address
- Destination IP address
- IP protocol
- Source port for UDP or TCP, 0 for other protocols
- Destination port for UDP or TCP, type and code for ICMP, or 0 for other protocols
- IP Type of Service
More recent versions, including IPFIX, define other fields, and even user-defined fields.
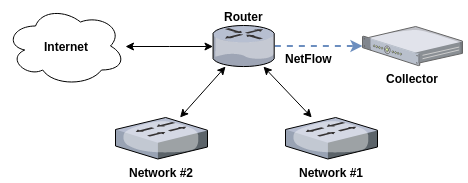
A typical NetFlow monitoring setup consists of three components:
- The flow exporter aggregates packets into flows and exports flow records towards one or more flow collectors. This is typically one or multiple routers.
- The flow collector is responsible for collecting and storing data received from one or multiple flow exporters.
- Analysis applications allow to process and analyze NetFlow data.
For this post, we will use a single Ubuntu server to export, collect and process NetFlow data:
- fprobe to export records
- nfdump to to analyze flows
- nfcapd (which is part of nfdump) to collect and store flows
nfcapd
To install nfdump (and nfcapd):
sudo apt-get install nfdump
To make sure nfcapd is started automatically, modify /etc/default/nfdump as follows:
nfcapd_start=yes
Start nfdump and nfcapd:
sudo service nfdump restart
By default, nfcapd will listen on port 2055 (UDP) and store NetFlow records in /var/cache/nfdump.
You can check this by typing
sudo service nfdump status
You should find a line like this one:
/usr/bin/nfcapd -D -l /var/cache/nfdump -P ... -p 2055
fprobe
You can now install fprobe:
sudo apt-get install fprobe
fprobe needs two configuration parameters:
- the network interface on which to listen
- where the collector is listening (127.0.0.1:2055 in this case)
You can modify the configuration of fprobe in /etc/default/fprobe
We can now start fprobe:
sudo service fprobe restart
If everything goes well, you will see new files appear in /var/cache/nfdump :
ls -lh /var/cache/nfdump
nfdump
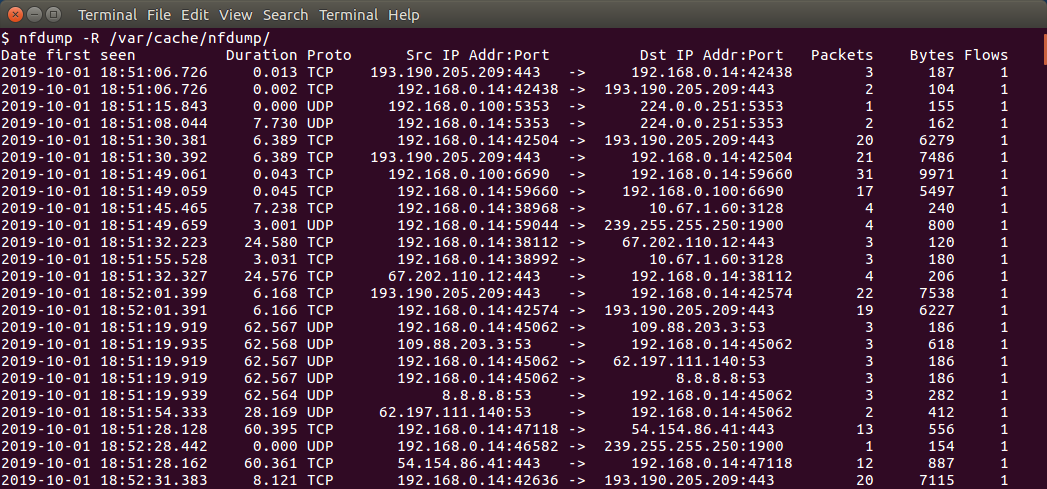
To analyze all files in a directory:
nfdump -R /var/cache/nfdump -o long
To specify a time window:
nfdump -R /var/cache/nfdump -t 2019/10/01-2019/10/01.23:59:59
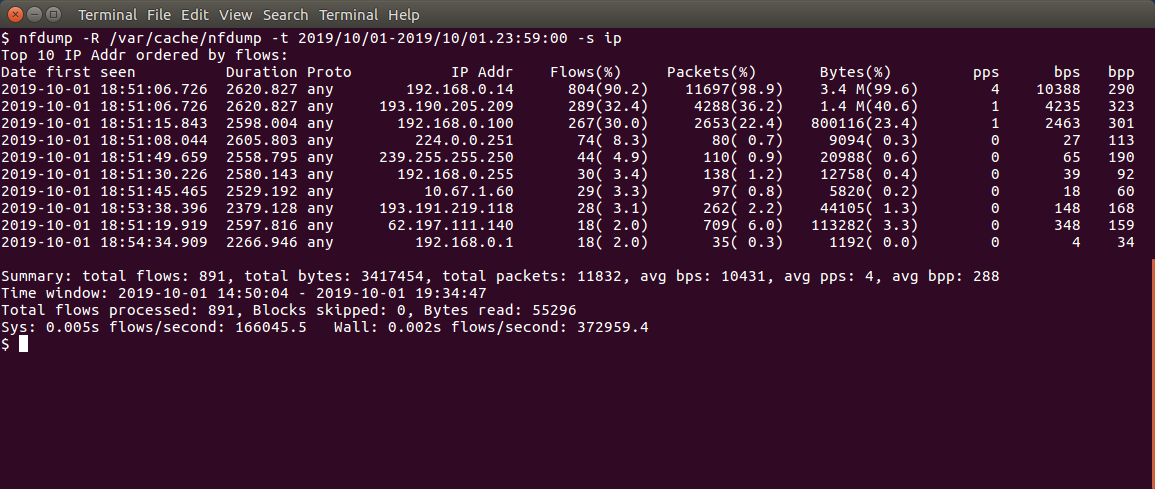
To get some aggregated statistics (top IP addresses for example):
nfdump -R /var/cache/nfdump -t 2019/10/01-2019/10/01.23:59:00 -s ip -O bytes
nfdump also supports Berkeley Packet Filter (BPF), just like tcpdump:
nfdump -R /var/cache/nfdump "port 443"
… and you will find a lot of other analysis possibilities in the man page of nfdump!
This blog post is licensed under
CC BY-SA 4.0


