Simulate user activity with the GHOSTS framework : Introduction
Apr 19, 2020 by Georgi Nikolov | 14180 views
https://cylab.be/blog/71/simulate-user-activity-with-the-ghosts-framework-introduction
When we want to test some detection algorithm we are developing, or we want to prepare a nice in-depth exercise for our students, we need to set up an ecosystem that closely resembles that of the real world. This can lead to some difficulties as in a real network we have multiple users, each with the own computer, surfing the net, working with files, or typing commands and sending requests to the network’s centralized server. It could pose a big challenge to model this if we don’t have a group of people available who we can task with sitting behind a computer and clicking on their mouse every so often to simulate real computer behaviour. There are tools available that help automate that, but in most cases they can be quite rudimentary.
Recently Carnegie Mellon University has released a suit of tools they have developed to be used during Red-Blue teaming exercises. Each of these tools is very interessting and I could spend a lot of time writing on them, but today I focus on one particular tool that could help us in the automation of simulated computer use and network traffic: GHOSTS.
The GHOSTS tool give us the possibility to set up a specific timeline that can be used to emulate the behaviour of a user on a specific computer. This fictional user is defined as an NPC (Non-Player Character) and follows a script of what actions should be taken at which points in time. This is very helpful when we want to design an exercise, or simulate background data, because it generates the background noise that is quite often used to obfuscate any malicious activity in a network. Without this background noise it is quite easy to single out a possible attack, as it would be the only real activity on the network and the detection becomes trivial.
This blog is part one of my exploration of the possibilities of the GHOSTS framework. I will go over the steps needed to set-up and do a test run of the GHOSTS tool. Further on I will try to configure my own timelines for the NPCs and do a multi-machine test to evaluate how useful it could be.
The GHOSTS Framework
The tool consists of two parts- a Server that handles the distribution of tasks and the collection of reports from the different NPC machines, and the Clients that run the timelines and act as our simulated users.
Further on the Server is split in three parts:
- an API server - responsible for the management of the Clients
- a PostgreSQL database - stores the information and data generated by the Clients
- a vizualisation tool using Grafana - a simple and elegant overview of the NPCs and their activity
The Client is the meat and bones of the tool as it is responsible for the automation of multiple applications that may run on a machine. It uses configuration files to set up the link between the Client and the Server, and a collection of tools and *.dll files to be able to access the programs installed on the machine. The deep dive into the Client’s code and automation of the different application will be a topic for a later blog post.
Setting up the GHOSTS framework
The GHOSTS GitHub page has a Wiki that gives a short explanation on how to set up the tool, but I discovered that there might be a certain lack of clarity in the explanations, so I figured to write my own little tutorial on the set-up procedures. First there is a choice to be made- do we want to install everything from scratch, or use docker containers? I opted for the latter option, as it seemed the less error prone.
Important Note: the installation and setting up of the GHOSTS Framework was done on a Ubuntu 18.04 machine
Setting up the Server
- Installing Docker
As we are working with Docker we need to install it on our machine.
First we need to update our apt repository:
$ sudo apt-get update
Once this operation is complete we can install docker and docker-composer via:
$ sudo apt install docker.io
$ sudo apt install docker-compose
After the installations we need setup and run the Docker service at start-up.
$ sudo systemctl start docker
$ sudo systemctl enable docker
To test if Docker is running we can verify its version:
$ docker --version
- Download and go through the the GHOSTS code
We can now download the GHOSTS tool from its repository at https://github.com/cmu-sei/GHOSTS
When we have downloaded the *.zip file and extracted it we are presented with multiple folders and configuration files:
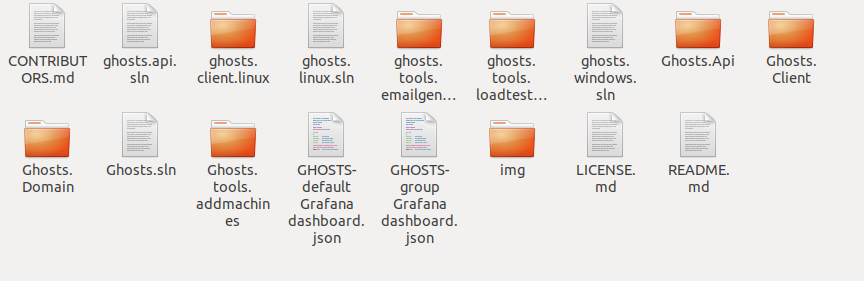
In the Ghosts.Api folder we can find all the code and configuration files responsible for setting up the GHOSTS server. Luckily the smart developers at Carnegie Mellon have also provided a docker-compose file that we can use to effortlessly download the docker images of the Server components from the internet and run them without much trouble.
If we open the docker-compose.yml file we can see how the different docker components for the Server API, PostgreSQL database and Grafana visualisation are configured. It is possible to execute docker-compose without changing anything to the *yml file, but personally I encountered a small problem with the virtual volume used by the Grafana visualisation so I had to make some changes to the *.yml configuration file.
Important Note: If you run docker-compose on the yml file and encounter an error with the ghosts-grafana container, saying that it lacks privileges to write to a specific folder, follow the instructions below
I adapted the docker-compose.yml file and changed the volume used by the Grafana container as follows:
  grafana:
    image: grafana/grafana
    container_name: ghosts-grafana
    depends_on:
      - postgres
    ports:
      - "3000:3000"
    networks:
      - ghosts-network
    restart: always
    volumes:
      - grafana-storage:/var/lib/grafana

volumes:
  grafana-storage:
Before you actually run docker-compose and download the containers, if you are like me and have a corporate proxy set-up on your network at work, you might need to configure the proxy configuration file of Docker. You will need to edit the /etc/systemd/system/docker.service.d/https-proxy.conf file by adding the following line:
[Service]
Environment="HTTPS_PROXY=https://proxy.example.com:443/"
Now that the proxy configuration file has been updated we need to reload daemon and restart docker.
 $ sudo systemctl daemon-reload
 $ sudo systemctl restart docker
- Downloading and running the Docker containers
Finally we can run docker-compose up -d, preferably from the Ghosts.Api folder so it can more easily find the docker-compose.yml file. Once it has terminated with the download and set-up of the docker containers we can view them by using the docker ps command. We can observe that three containers will be running:
- ghosts API located at: http://localhost:5000/api/home
- ghosts Postgres DB at: http://localhost:5432
- grafana dashboard at: http://localhost:3000
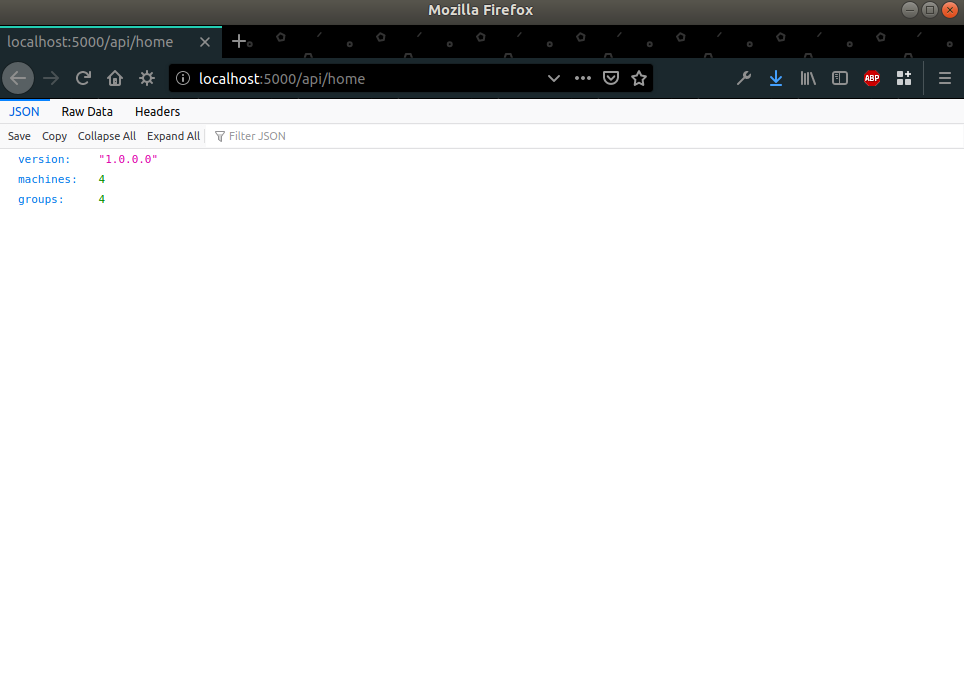
Each of these containers is running a service on the localhost, on a specific port. If we go to the Ghosts API link we can see a basic website layout with some information
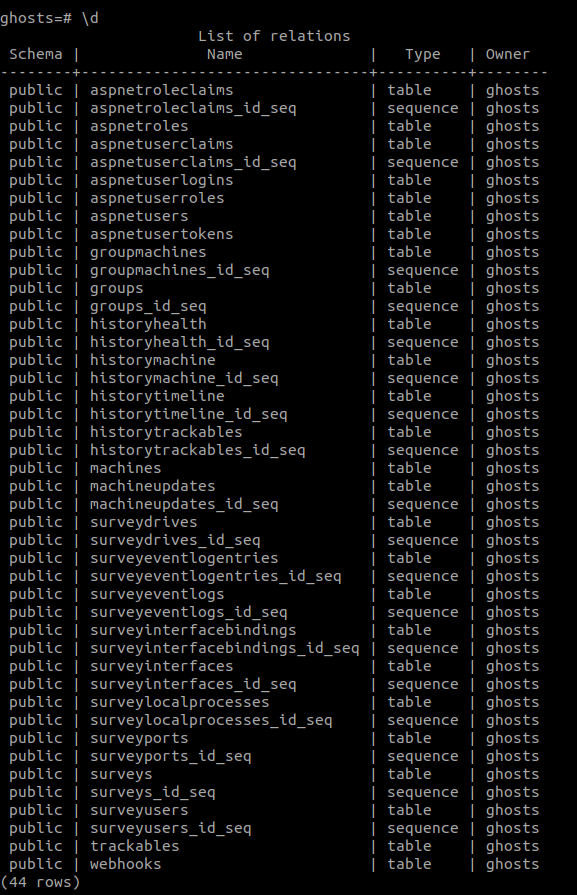
If we are interested in viewing the contents of the PostgreSQL database we can do that via Docker by running:
$ docker exec -it ghosts-postgres psql -U ghosts
From there we have couple of options we can use to view the contents:
llist all databasesc ghoststo connect to the “ghosts” databasedto view all tables in a databased+ "table name"for information on a specific table- can use SQL queries to view data in tables (
SELECT * FROM machinesex.) qto exit the container
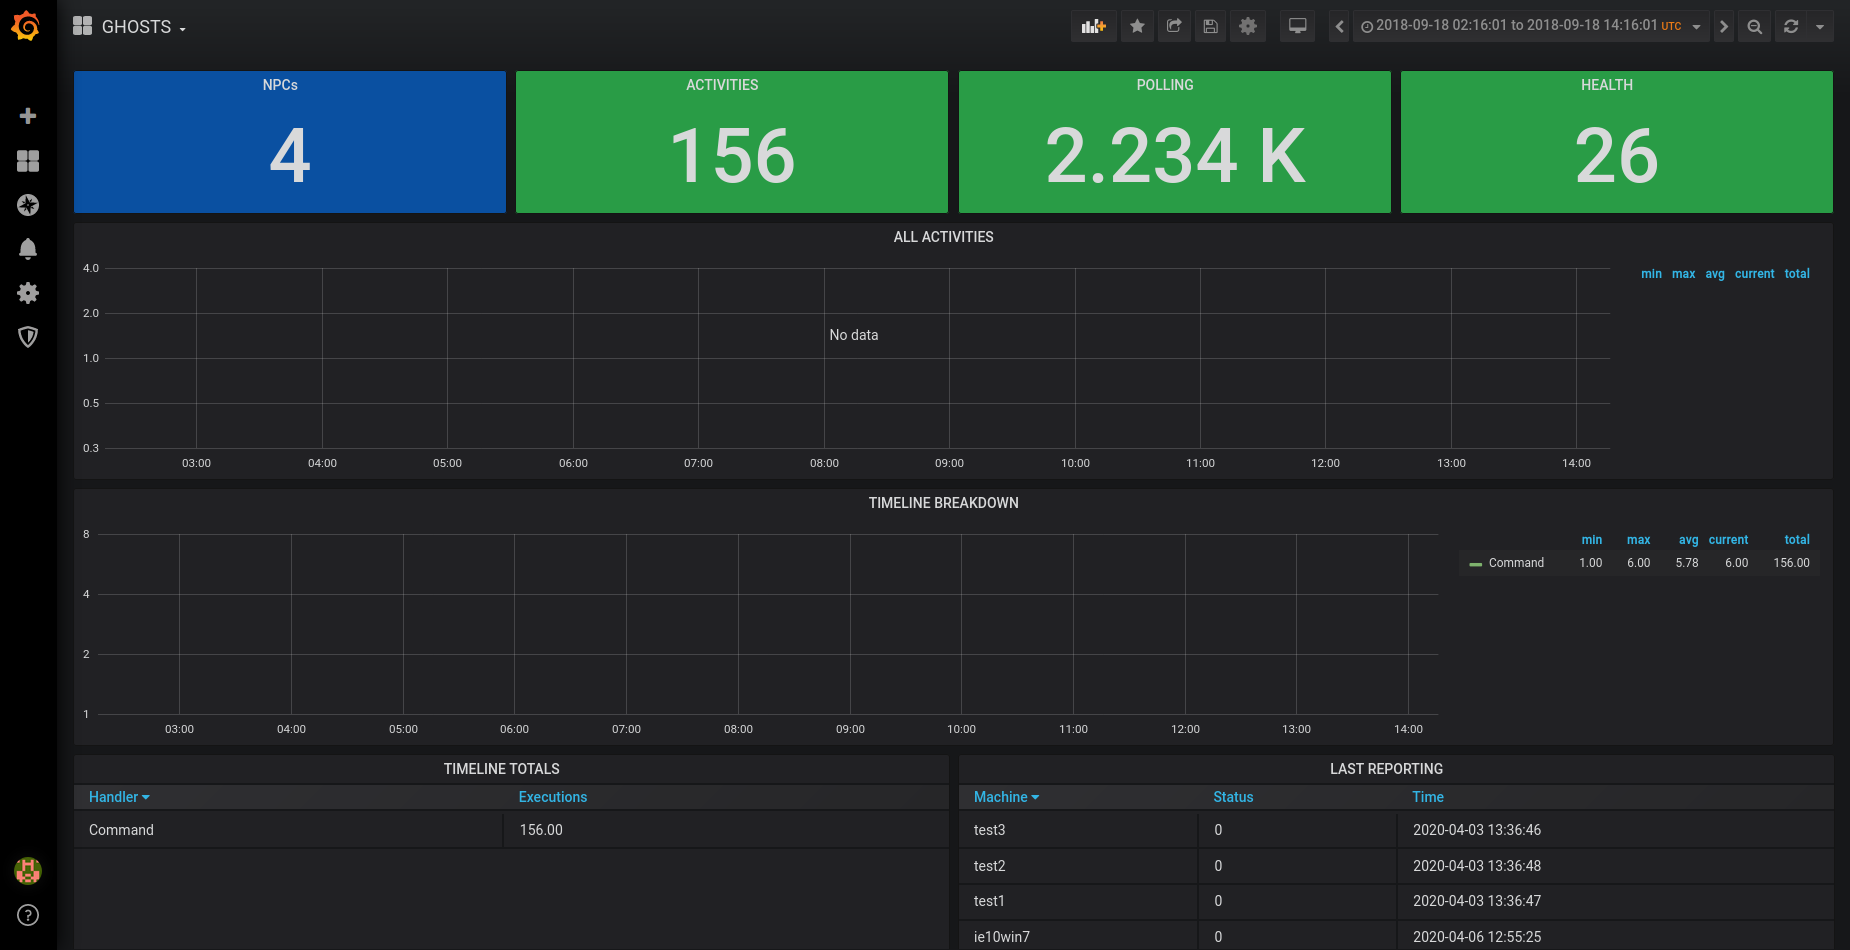
- Setting up Grafana
When we are done exploring the Server API and the PostgreSQL, we can set up the Grafana visualisation tool. We can access it by going to http://localhost:3000. The default login for Grafana is admin:admin. From there we are prompted to setup the data source to be used by the visualisation tool and the type of visualisations we want to use.
When setting up the datasource, we need to provide the IP of the docker container running PostgreSQL. At first I tried to give it the http://127.0.0.1:5432 IP, but no connection could be established to the database. After some research I discovered I need to provide it with the IP address of the docker container instead. To do that we need to run the following command in command prompts:
$ docker inspect -f '{{range .NetworkSettings.Networks}}{{.IPAddress}}{{end}}' ghosts-postgres
For me the IP of the container was 172.18.0.2:5432. Now I could finish setting up the data source:
- Host: 172.18.0.2:5432
- Database: ghosts
- User: ghosts
- Password: scotty@1
- SSL Mode: disable
- Version: 10
Once we are done filling in the fields we can Save&Test the data source.
Afterwards we need to set-up the dashboard, select what types of visualisations we want to display. Luckily again the smart people at Carnagie Mellon have provided us with two *.json files that can be easily imported into Grafana to initialize the dashboard.
- go on the left side to Dashboard->Manage
- Import -> Upload json file
- find the
GHOSTS-default Grafana dashboard.jsonfile in the downloaded GHOSTS code - Import
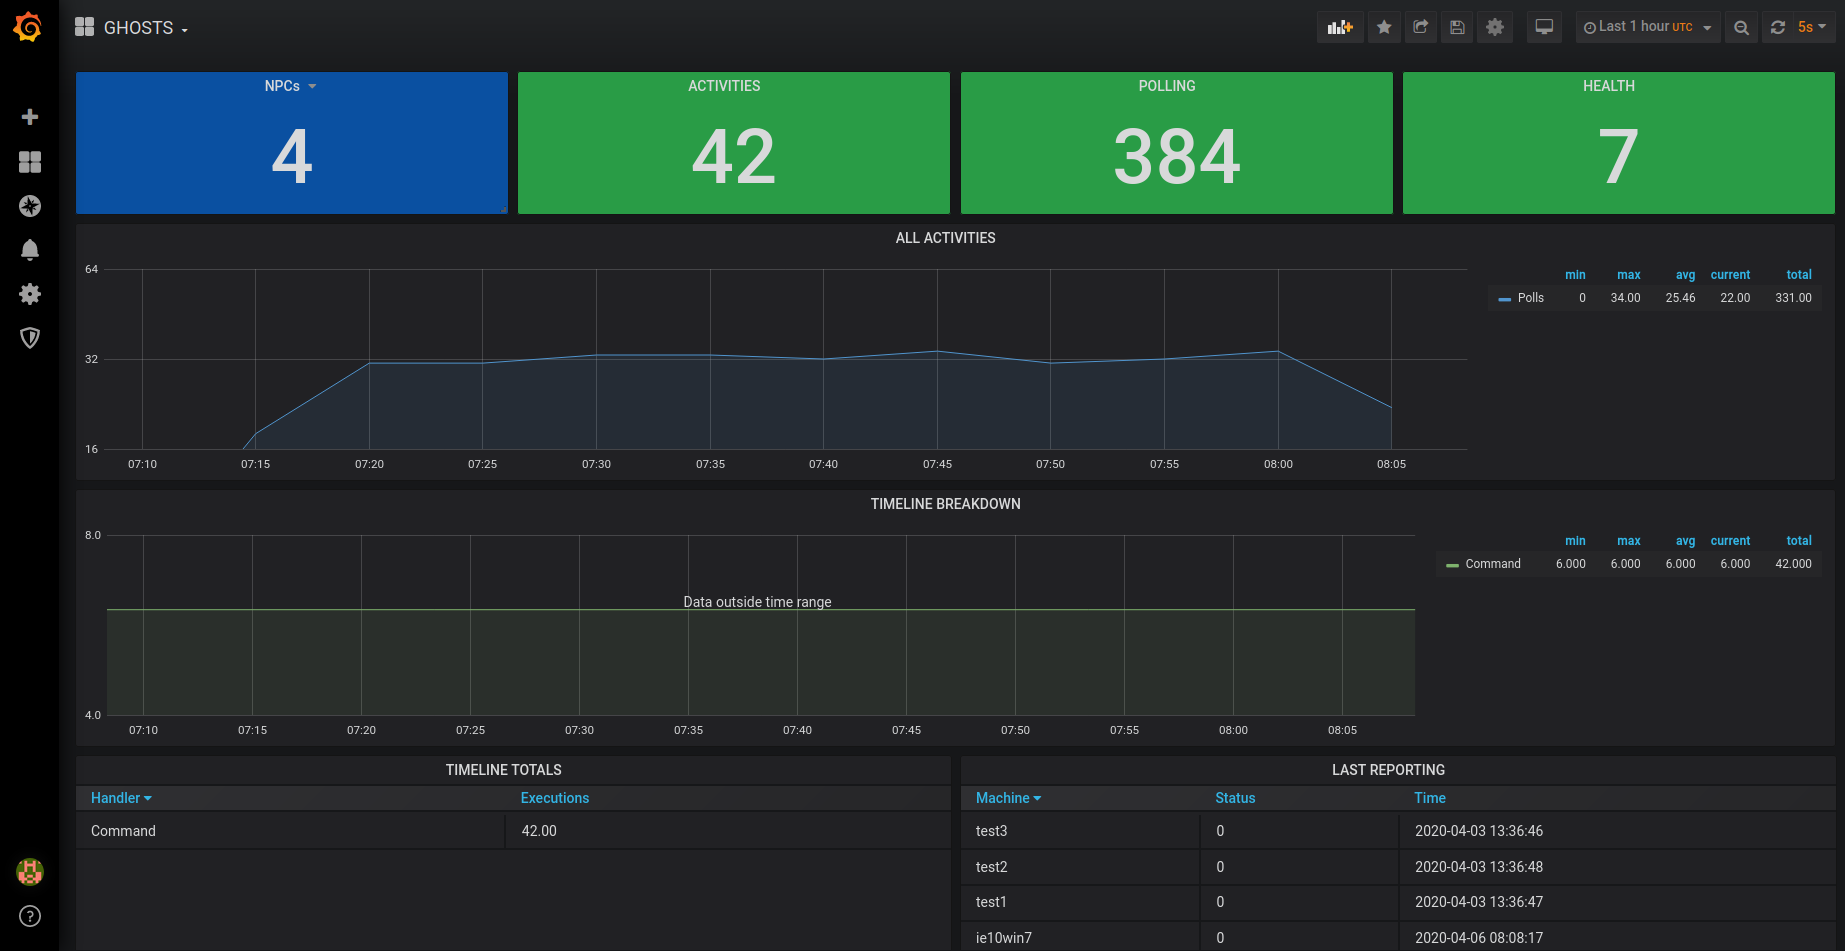
When all this is done, we are presented with a nice simple dashboard, that we can easily extend and adapt depending on our needs.
Setting up Client
We have the Server side of the GHOSTS tool running, now it is time to create a simple Client. To do that I have set-up a simple VirtualBox Windows7 machine. I also ran a simple PING check to see if my Win7 VM can see the GHOSTS-API docker container.
$ docker inspect -f '{{range .NetworkSettings.Networks}}{{.IPAddress}}{{end}}' ghosts-api
$ 172.18.0.3
From the Win7 VM
$ ping 172.18.0.3:5000
It seems that the GHOSTS Client also needs Microsoft DotNet 4.7.x runtime to be installed on the Windows machine. You don’t need to install the SDK, just the runtime.
From there we can download the Windows client binaries from Carnegie Mellon: client zip file v3.0. Create a folder on the C-drive as such C:ghosts, that way the folder is not in the path of any possible exercises you might have planned for the machine. Extract the *.zip file to the newly created folder. The most important files on the Client are situated in the config folder.
The application.json config file is responsible for the connection to the GHOSTS Api server and what type of data will be produced by the machine. We need to adapt the C:ghostsconfigapplication.json file with the address of the ghosts-api machine (in my case 172.18.0.3:5000) in all necessary places.
"IdEnabled": true,                                                      //enabled in order to command and control from api (C2) server
    "IdUrl": "http://yourapiurl.com/api/clientid",                          //url for API endpoint to get clientid
    "ClientResultsEnabled": true,                                           //enabled to report results to C2
    "ClientResultsUrl": "http://yourapiurl.com/api/clientresults",          //url for API endpoint to report results
    "ClientResultsCycleSleep": 90,                                          //report results every x ms
    "ClientUpdatesEnabled": true,                                           //enabled to get updates from C2
    "ClientUpdatesUrl": "http://yourapiurl.com/api/clientupdates",          //url for API endpoint to get updates
    "ClientUpdatesCycleSleep": 90,                                          //check for updates every x ms
    "Survey": {                                                             //survey is a local report of processes running, etc.
        "IsEnabled": true,                                                  //on/off
        "Frequency": "once",                                                //how often to survey
        "MaxAgeInHours": 168,                                               //how long to wait until new survey
        "OutputFormat": "indent"                                            //compact/fancy(indent)
    },
    "HealthIsEnabled": true,                                                //enable local health checks
    "HandlersIsEnabled": true,                                              //enable local timeline activity
    "ChromeExtensions": "",                                                 //comma separated local extensions (used for injects in the past)
    "FirefoxInstallLocation": "",                                           //geckodriver needs this for non-standard installs (is pesky)
    "FirefoxMajorVersionMinimum": 48,                                       //geckodriver is picky about versions
    "OfficeDocsMaxAgeInHours": 6,                                           //cleanup kills docs in the documents folder older than this setting
    "Email": {
        "RecipientsToMin": 1,
        "RecipientsToMax": 3,
        "RecipientsCcMin": 0,
        "RecipientsCcMax": 2,
        "RecipientsBccMin": 2,
        "RecipientsBccMax": 2,
        "RecipientsOutsideMin": 0,
        "RecipientsOutsideMax": 1,
        "SetAccountFromConfig": false,
        "SetAccountFromLocal": false,
        "SetForcedSendReceive": false,
        "SaveToOutbox": false,
        "EmailDomainSearchString": "Get-ADUser -filter * -searchbase "CN=USERS,DC=JRSS,DC=GOV" -properties UserPrincipalName | select -expand UserPrincipalName"
    },
    "Listener": {
        "Port": 8443                                                        //local listener port on client to receive commands from C2 (C2 requires the same port number setting as the sender)
    },
    "EmailContent": {
        "conflict_1_capital": "",
        "conflict_1_name": "",
        "conflict_1_peoples": "",
        "conflict_1_president": "",
        "localized_flashpoint_locale": "",
        "friendly_nation_leader_lastname": "",
        "friendly_nation_leader_name": "",
        "friendly_nation_name": "",
        "friendly_nation_peoples": "",
        "commander_title": "",
        "commander_name": "",
        "commander_initials": "",
        "commander_lastname": "",
        "commander_email": "",
        "commander_sub1": "",
        "commander_sub2": "",
        "us_president": "",
        "iraq": "",
        "iraqi": "",
        "iran": "",
        "iranian": "",
        "china": "",
        "chinese": "",
        "russia": "",
        "azerbaijan": "",
        "turkish": "",
        "turkey": "",
        "pakistani": "",
        "pakistan": "",
        "palestinian": "",
        "palestine": "",
        "gaza": "",
        "korea": ""
    }
}
The dictionary.json is a word list that is used to generate text within random Word documents.
[
    "data",
    ...
]
The email-content.csv is used to generate random email subjects and bodies. Tags are substituted with values from the email settings in the application.json configuration file.
"7477"|"LATIMES OP ED"|"From: <commander_sub1/>
Sent:  Monday, September 27, 2017 10:38 AM
To:
Subject: Fw: LATimes op ed Attachments: 1ATimes - Why H. <commander_lastname/>
The email-reply.csv is a collection of short text strings used in random responses.
The email-domain.json and email-outside.json are used respectively to generate and send random messages and “External company” emails (are mock-ups of major government contractor companies).
The health.json file is responsible for configuring the local checks the client undergoes periodically.
{
    "Sleep": 600000,                //Sleep time between posting client results up to the API for each client.
    "CheckUrls": [                  //Urls that the client will GET request to confirm their internet connectivity
        "http://google.com",
        "http://cmu.edu"
    ]
}
Finally the timeline.json configuration file is responsible for the behaviour of the NPC running on this machine. We can specify commands or activity the machine has to run or do, by defining it, as an example:
{
   "HandlerType": "Command",
   "Initial": "",
   "UtcTimeOn": "00:00:00",
   "UtcTimeOff": "24:00:00",
   "Loop": "True",
   "TimeLineEvents": [
      {
         "Command": "NETSTAT",
         "CommandArgs": [],
         "DelayAfter": 900000,
         "DelayBefore": 0
      }
   ]
}
Now that we have adapted the configuration files to our needs the only thing left to do is run ghosts.exe and let it run in the background while we see the output using the Grafana visualisation.
Our set-up of the GHOSTS framework ends here, but there is still much more to explore, next we will set up the timelines on the Windows Client VM to simulate user activity. You can read more about that at:
This blog post is licensed under
CC BY-SA 4.0


