Benchmark Linux systems with sysbench
Mar 24, 2024 by Thibault Debatty | 37782 views
https://cylab.be/blog/330/benchmark-linux-systems-with-sysbench
In this blog post, I will show how to use sysbench to test the CPU, memory and storage performance of a Linux system. I also had the chance to access some diverse hardware (laptop, desktop, servers). So I’ll also give some results for you to compare with.

The platforms that I will benchmark are:
- a recent laptop with a mobile Intel processor and SSD;
- a desktop computer with Intel processor and SSD;
- an old server equipped with 4 Xeon processors, RAID controller and spinning disks;
- a server with AMD CPU, RAID controller and an array of SSD.
Update June 2024 : I added a VirtualBox VM to the comparison.
Installation
You can usually install sysbench with:
sudo apt install sysbench
CPU
Single thread
You can run sybench cpu test with:
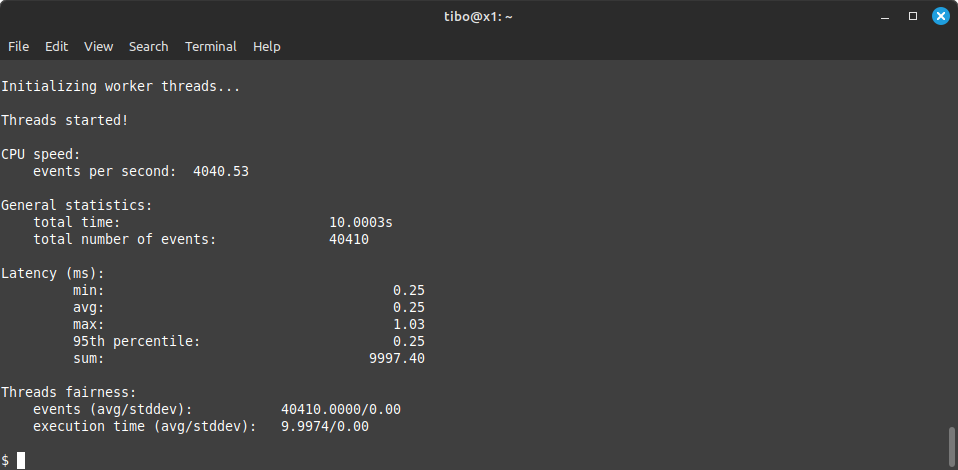
sysbench cpu run
The result is expressed in “events per second” (4040 in the example below):
Multi-thread
By default, sysbench runs cpu test with a single thread. To test multi-thread performance of your CPU, you should first determine the number of available threads:
grep processor /proc/cpuinfo | wc -l
Then you can run sysbench again, specifying the number of threads:
sysbench cpu run --threads=<threads>
Results
| Platform | CPU | Single thread [evts/sec] | Threads | Multi-thread [evts/sec] |
|---|---|---|---|---|
| Laptop | Intel Core i7-1260P | 3354 | 16 | 33283 |
| Desktop | Intel Core i5-12400F | 3773 | 12 | 21730 |
| Server 1 | 4 x Xeon E7-4830 v3 | 834 | 96 | 55604 |
| Server 2 | AMD EPYC 7402P | 1662 | 48 | 42003 |
Memory
Now, you can measure the speed of your memory with
sysbench memory run
The result is the measure transfer speed, expressed in MiB/sec.
If you want to compare your results with mine, you can also check the type and speed of your installed memory with:
sudo dmidecode --type 17
Results
| Platform | Memory | Transfer speed [MiB/sec] |
|---|---|---|
| Laptop | LPDDR5 6400 MHz | 10691 |
| Desktop | DDR4 2133 MHz | 10000 |
| Server 1 | DDR4 2133 MHz | 4525 |
| Server 2 | DDR4 3200 MHz | 5822 |
Storage
You can also use sysbench to test the performance of you storage devices. This is a little more subtle for different reasons:
- storage benchmarking requires to first create some test files;
- SSD and RAID cards have a built-in controller with cache that will largely influence the results;
- the default test parameters of sysbench do not reflect real-life utilization of storage devices.
So the first thing to do is to create files that will be used for testing:
sysbench fileio --file-total-size=5G --file-num=5 prepare
As mentioned above, I will use additional parameters to run the test. This will be more representative of actual usage, and allows the controller and cache to be used during the test:
- run the test in
asyncmode; - synchronize storage only once at the end of the test;
- for sequential access test, use larger 1MB blocks;
- for random access test, use smaller 4KB blocks.
To test random storage access:
sysbench fileio --file-total-size=5G --file-num=5 --file-io-mode=async --file-fsync-freq=0 --file-test-mode=rndrd --file-block-size=4k run
sysbench fileio --file-total-size=5G --file-num=5 --file-io-mode=async --file-fsync-freq=0 --file-test-mode=rndwr --file-block-size=4k run
To test sequential access:
sysbench fileio --file-total-size=5G --file-num=5 --file-io-mode=async --file-fsync-freq=0 --file-test-mode=seqrd --file-block-size=1M run
sysbench fileio --file-total-size=5G --file-num=5 --file-io-mode=async --file-fsync-freq=0 --file-test-mode=seqwr --file-block-size=1M run
Results
| Platform | Storage | rnd read [MiB/sec] | rnd write [MiB/sec] | seq read [MiB/sec] | seq write [MiB/sec] |
|---|---|---|---|---|---|
| Laptop | 2TB Samsung SSD 980 PRO NVMe | 4493 | 2853 | 12307 | 4955 |
| Laptop | 2TB Crucial X8 portable SSD | 4428 | 1966 | 12278 | 1616 |
| Desktop | 2TB Samsung SSD 990 PRO NVMe | 4206 | 3403 | 15925 | 8165 |
| Server 1 | RAID controller with a single 15000 rpm SAS spinning disk | 1091 | 48 | 3326 | 418 |
| Server 1 | RAID controller with an array of 15000 rpm SAS spinning disks | 1055 | 22 | 2905 | 490 |
| Server 2 | RAID controller with an array of 3 SATA SSD | 2615 | 1453 | 10472 | 2736 |
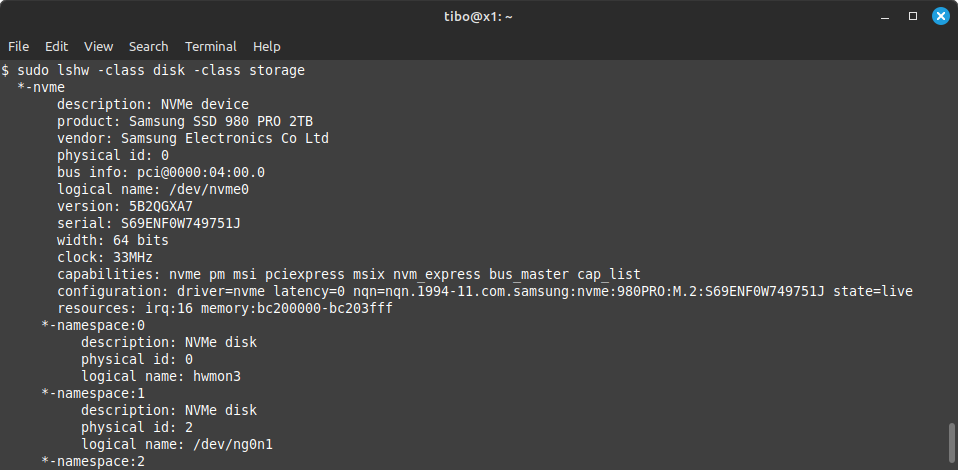
Also, note that you can use the following command line to check the type of storage on your system:
sudo lshw -class disk -class storage
VirtualBox VM
To add some elements of comparison, I deployed a VirtualBox VM on Server 2. The VM has 4 cores, 4GB of RAM, and a single VDI disk. Here are the results I got, compared with the results of the host server:
| VM | Host server | Difference | |
|---|---|---|---|
| CPU : Single thread [evts/sec] | 1572 | 1662 | -5% |
| CPU : 4 threads [evts/sec] | 5996 | 6631 | -9% |
| Memory : Transfer speed [MiB/sec] | 5111 | 5822 | -12% |
| Storage : rnd read [MiB/sec] | 78 | 2615 | -97% |
| Storage : rnd write [MiB/sec] | 134 | 1453 | -90% |
| Storage : seq read [MiB/sec] | 1187 | 10472 | -88% |
| Storage : seq write [MiB/sec] | 795 | 2736 | -70% |
As one could expect, there is a small penalty of using a VM with respect to CPU and memory. The storage penalty however is staggering: 90% of performance drop!
I double checked on an other server and came to the same conclusion: using a virtual disk causes a performance drop of roughly 90%.
This blog post is licensed under
CC BY-SA 4.0


