Getting Started with libbpf - Tracking execve Syscalls with eBPF and CO-RE
Apr 9, 2025 by Zacharia Mansouri | 9614 views
https://cylab.be/blog/406/getting-started-with-libbpf-tracking-execve-syscalls-with-ebpf-and-co-re
Curious to observe every process invocation on a Linux system? This article will walk you through building a minimal eBPF program that attaches to the execve syscall using libbpf and CO-RE for portability across kernel versions. It covers compiling with Clang, setting up a ring buffer for efficient event transmission, and writing a simple C loader to manage initialization and execution, all without requiring kernel modules. It’s way easier than it looks, and way more fun than it should be!
For a better CO-RE experience that guarantees your binary runs on any target machine by statically linking dependencies and automating kernel testing, check out our comprehensive guide on portable eBPF development.
Before diving into this blog post, you might be interested into writing eBPF programs using Python and BCC. Here is an introduction that explains the motivation behind the use of eBPF as well as how to smoothly start writing such programs.
To truly grasp the potential of eBPF, let’s begin by quickly exploring how it works from the ground up.
eBPF (extended Berkeley Packet Filter) is a powerful technology that allows you to run user-defined programs in the kernel, making it possible to trace, monitor, and interact with system-level events. It’s like running small, efficient snippets of code directly inside the kernel, without needing to modify the kernel itself. This is achieved by loading eBPF programs from user-space, allowing fine-grained control over how the kernel processes system calls, network packets, and more. These programs can hook into various parts of the kernel to track system events, such as the execve syscall, which handles the execution of programs.
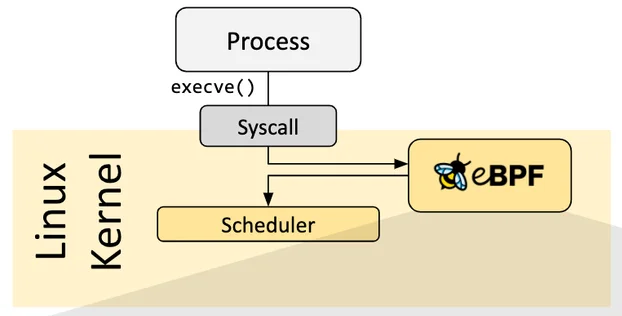
When working with eBPF, the primary interaction happens through syscalls like bpf(), which is used to load the program into the kernel and attach it to a specific event or trace point. You can attach eBPF programs to various types of hooks (tracing system calls, network events, or performance metrics) allowing real-time visibility and control. Once the program is loaded, it interacts with kernel space to collect data or trigger specific actions without the need to modify or insert new kernel code. For example, as you can see on the diagram below (source), by attaching to execve, you can monitor whenever a new process is executed on the system, making it useful for auditing or security purposes. The flexibility of eBPF and the power of user-space program loading allow for highly efficient, non-intrusive monitoring of system activities.
Required dependencies
As stated in the libbpf github README, in order to develop and build BPF programs, you’ll need Clang/LLVM 10+. The following distributions have Clang/LLVM 10+ packaged by default:
- Fedora 32+
- Ubuntu 20.04+
- Arch Linux
- Ubuntu 20.10 (LLVM 11)
- Debian 11 (LLVM 11)
- Alpine 3.13+
However, for a ubuntu/jammy64 vagrant virtual machine, the following tools were necessary to install, be sure to check you have them all beforehand!
# Update
sudo apt update

# Use Makefile
sudo apt install make

# Use bpftool
sudo apt install linux-tools-common linux-tools-generic linux-tools-$(uname -r)

# Compile eBPF code with clang
sudo apt install clang llvm

# Use the libbpf library
sudo apt install libbpf-dev

# Some other dependencies
sudo apt install libelf-dev
sudo apt install build-essential
Writing the user and kernel space programs
In order to have a running eBPF program in the kernel, two files are needed, one containing the eBPF kernel-space program (exec.bpf.c) that will be injected into the kernel in order to be run by the eBPF virtual machine (based on LLVM), and another one (exec.c) that will prepare the kernel and inject the program from the user-space.
The following exec.bpf.c file contains the core of the eBPF program:
#include "vmlinux.h"
#include <bpf/bpf_helpers.h>

SEC("tracepoint/syscalls/sys_enter_execve")
int handle_execve(void *ctx) {
  bpf_printk("Exec called!\n");
  return 0;
}

char LICENSE[] SEC("license") = "GPL";
It will be attached to a tracepoint inside the kernel that is triggered when entering the execve system call. This means that each time execve is called, the string "Exec called!\n" will be printed somewhere (we’ll see later where it is printed). The license of any eBPF program is mandatory, otherwise the program will not compile.
Now the user-space code exec.c:
#include "exec.skel.h"

int main(void) {
  struct exec *skel = exec__open();
  exec__load(skel);
  exec__attach(skel);

  for (;;) {}
  return 0;
}
The exec.skel.h will be covered later, when specifying how to generate a skeleton in the compilation process. The three exotic functions called in the main will achieve the following:
exec__open: parse the content of the eBPF object file, e.g., the eBPF program(s) maps and the global variables.exec__load: instantiate eBPF maps, resolve relocations and load then verify eBPF program(s) in the kernel.exec__attach: attach the program(s) to various eBPF hook points such as tracepoints, kprobes, uprobes, etc. The infiniteforloop will prevent the eBPF program from closing right after being called, ensuring it’s running until we decide to interrupt it.
Building the Executable for Your eBPF Program
When developing eBPF programs, there are several steps involved in generating headers, compiling, and linking everything together to create the final executable. Here’s how you can do it step by step.
Generate vmlinux.h
The first step in building your eBPF program is to extract kernel BTF (BPF Type Format) information, which is crucial for defining kernel structures that your eBPF program may need. This is done with the bpftool utility:
bpftool btf dump file /sys/kernel/btf/vmlinux format c > vmlinux.h
This command extracts the BTF data from the kernel and converts it into a C header file (vmlinux.h). This file contains type definitions that are necessary for interacting with kernel structures. It’s important to include #include "vmlinux.h" at the top of your header files because it defines the kernel data types that your eBPF program will use, such as the task_struct or execve parameters.
Compile the eBPF Program
Once you have your BTF data, it’s time to compile the eBPF program itself. The exec.bpf.c file contains your eBPF code, and it can be compiled into an object file with the following command:
clang -g -O2 -target bpf -c exec.bpf.c -o exec.bpf.o
This command uses clang to compile the exec.bpf.c file into an object file (exec.bpf.o). The -target bpf flag ensures that the code is compiled for the eBPF virtual machine. The -g flag adds debugging information, while -O2 enables optimization to improve the performance of the compiled code.
Generate the Skeleton Header
Next, we need to generate the skeleton header file, which simplifies the interaction between user-space and the eBPF program. The skeleton is essential because it automatically generates the necessary functions for loading, attaching, and working with your eBPF program.
To generate the skeleton header, we run:
bpftool gen skeleton exec.bpf.o name exec > exec.skel.h
rm exec.bpf.o
Here, bpftool gen skeleton takes the compiled object file (exec.bpf.o) and generates the exec.skel.h header. This skeleton file contains the functions exec__open(), exec__load(), and exec__attach(), which are used to open, load, and attach your eBPF program. After generating the skeleton, we remove the original object file (exec.bpf.o) to keep things tidy.
One important note: the exec name here is significant. The functions in the skeleton (exec__open, exec__load, exec__attach) are prefixed with the name you provide. So, if you were to use a different name, such as myprogram, the functions would be myprogram__open, myprogram__load, and myprogram__attach.
Build the Main Target
With the skeleton header in place, you can now compile the user-space component of your eBPF program, which interacts with the kernel code:
clang exec.c -lbpf -o exec
This command compiles the exec.c file, which contains the user-space logic for interacting with the eBPF program. The -lbpf flag links the necessary BPF library, enabling the program to interact with eBPF features provided by the kernel. After compiling, you’ll have an kernel-dependent executable named exec.
Binding Everything Together
At this point, you should have the following three files:
Makefileexec.cexec.bpf.c
These files will form the complete eBPF program. To make building everything easier, here’s a Makefile that automates the process:
exec: skel
	clang exec.c -lbpf -o exec

vmlinux:
	bpftool btf dump file /sys/kernel/btf/vmlinux format c > vmlinux.h

bpf: vmlinux
	clang -g -O2 -target bpf -c exec.bpf.c -o exec.bpf.o

skel: bpf
	bpftool gen skeleton exec.bpf.o name exec > exec.skel.h
	rm exec.bpf.o

clean:
	- rm -rf *.o *.skel.h vmlinux.h exec
This Makefile defines the entire build process, from generating vmlinux.h to compiling the eBPF program, generating the skeleton, and linking the user-space program.
Warnings During Compilation
While building the program, you might encounter a warning like this:
libbpf: elf: skipping unrecognized data section(4) .rodata.str1.1
Although this warning may seem concerning, it won’t prevent the compilation or execution of the program. The message simply indicates that the BPF library encountered a section in the ELF file (.rodata.str1.1) that it doesn’t recognize. This is generally harmless and can be ignored, as it doesn’t impact the functioning of your eBPF program.
Running the executable
sudo ./exec
- Runs
execwithrootrights, mandatory to run the eBPF program inside the kernel. - In order to see the output of this program, open a second and a third terminal.
- In the 2nd terminal, open the file at which all eBPF programs calling
bpf_printkwill write their output:sudo cat /sys/kernel/debug/tracing/trace_pipe. - In the 3rd terminal, launch various commands such as
ls, you’ll see the"Exec called!"message printed in the 1st terminal
- In the 2nd terminal, open the file at which all eBPF programs calling
If libbpf-dev is not installed on your system, you will see the following error:
./exec: error while loading shared libraries: libbpf.so.0: cannot open shared object file: No such file or directory
Building a CO-RE Executable
You can take advantage of CO-RE (Compile Once, Run Everywhere) functionality provided by libbpf. With CO-RE, your eBPF program will run on any kernel version, making it much more portable.
Building libbpf
To get started, first clone the libbpf repository and build the libbpf.a library:
# Clone the project
git clone https://github.com/libbpf/libbpf

# Create the build directory
mkdir -p libbpf/build

# Build the library files
make -C libbpf/src BUILD_DIR=../build OBJDIR=../build
Modifying the Makefile
Next, you’ll need to update your Makefile to use libbpf during compilation. Specifically, modify the section that builds the exec executable:
exec: skel
	clang exec.c -lbpf -o exec

# Rest of the file...
Update it to this:
exec: skel
	- clang -g -O2 -Wall -I . -c exec.c -o exec.o
	- clang -Wall -O2 -g exec.o libbpf/build/libbpf.a -lelf -lz -o exec

# Rest of the file...
Building the Executable
In this updated Makefile, the exec.o object file is first created, and then the exec executable is built using that object file along with the libbpf.a library. You can now run make to build your CO-RE executable.
Testing Across Different Kernel Versions
Once you’ve built the executable, you can install different kernel versions to test if your program still runs on them. Here are a few commands to help you verify CO-RE’s cross-kernel compatibility (be careful when changing your kernel since it may break your system, favor the use of a virtual machine to do this):
# Search for available kernel images
sudo apt search linux-image
# Example output:
# ...
# linux-image-6.11.0-21-generic
# linux-image-6.8.0-50-generic
# ...

# Install a kernel image (reboot required afterward):
sudo apt install linux-image-6.8.0-50-generic linux-headers-6.8.0-50-generic
Sharing Data Between User and Kernel Spaces with Ring Buffers
Using bpf_printk() is helpful for debugging, but it quickly becomes limiting. All logs go to the same trace pipe (located at /sys/kernel/debug/tracing/trace_pipe), making it hard to separate output from multiple programs. More importantly, we often need to share structured data (not just strings) between different eBPF programs and with user-space applications. This is where ring buffers come in: they allow us to efficiently stream typed events from kernel space to user space, and let our user-space executable handle the output directly.
eBPF ring buffers are a mechanism used to efficiently transfer data between eBPF programs and user-space applications. They provide a circular buffer that allows eBPF programs running in the kernel to push events or data to user-space without blocking or dropping information. The user-space application can read from the buffer at its own pace, and once it reads the data, the buffer automatically wraps around to overwrite older data. This makes ring buffers ideal for handling high-frequency events with minimal overhead and ensures data is not lost during heavy kernel activity.
To make this work cleanly, we’ll restructure our codebase. We’ll update exec.bpf.c to send structured data instead of just logging, write a new exec.h header to define the shared data structure, and modify exec.c to receive and display that data from the ring buffer. This separation ensures both the kernel-side BPF program and the user-space code operate on the same event format, making the communication between them reliable and easy to maintain.
Here is the updated exec.h with the new data structure we’ll be using:
#ifndef __EXEC_H__
#define __EXEC_H__

struct exec_evt {
  pid_t pid;
  pid_t tgid;
  char comm[32];
  char file[32];
};

#endif // __EXEC_H__
Kernel-space code update
Here is the final version of exec.bpf.c:
#include "vmlinux.h"
#include <bpf/bpf_helpers.h>
#include <bpf/bpf_core_read.h>
#include "exec.h"

struct {
  __uint(type, BPF_MAP_TYPE_RINGBUF);
  __uint(max_entries, 256 * 1024);
} rb SEC(".maps");

struct exec_params_t {
  u64 __unused_64_bits_0;
  u64 __unused_64_bits_1;
  char *file;
};

SEC("tracepoint/syscalls/sys_enter_execve")
int handle_execve(struct exec_params_t *params) {

  struct task_struct *task = (struct task_struct*)bpf_get_current_task();
  struct exec_evt *evt = {0};

  evt = bpf_ringbuf_reserve(&rb, sizeof(*evt), 0);
  if (!evt) {
    bpf_printk("Ring Buffer not reserved\n");
    return 1;
  }

  evt->pid = BPF_CORE_READ(task, pid);
  evt->tgid = BPF_CORE_READ(task, tgid);
  bpf_get_current_comm(&evt->comm, sizeof(evt->comm));
  bpf_probe_read_user_str(&evt->file, sizeof(evt->file), params->file);
  bpf_ringbuf_submit(evt, 0);
  bpf_printk("Exec called!\n");
  return 0;
}

char LICENSE[] SEC("license") = "GPL";
We started with a minimal eBPF program that attaches to the sys_enter_execve tracepoint:
SEC("tracepoint/syscalls/sys_enter_execve")
int handle_execve(void *ctx) {
  bpf_printk("Exec called!\n");
  return 0;
}
This version is useful to quickly verify that our tracepoint hook is firing, but it doesn’t collect any data beyond a printk log. It also uses a generic void *ctx signature, which doesn’t give us access to syscall parameters in a structured way.
In a more advanced version, we improve on this by adding a ring buffer for user-space communication:
struct {
  __uint(type, BPF_MAP_TYPE_RINGBUF);
  __uint(max_entries, 256 * 1024);
} rb SEC(".maps");
This introduces BPF_MAP_TYPE_RINGBUF, a fast, lockless buffer optimized for sending structured data from kernel to user space.
To access the tracepoint arguments cleanly, we define a parameter structure like this:
struct exec_params_t {
  u64 __unused_64_bits_0;
  u64 __unused_64_bits_1;
  char *file;
};
The fields __unused_64_bits_0 and __unused_64_bits_1 together account for 128 bits. This aligns with the offset at which we retrieve the filename argument from the sys_enter_execve tracepoint, as detailed in the format definition of sys_enter_execve found at /sys/kernel/debug/tracing/events/syscalls/sys_enter_execve/format. The filename is located at offset 16 bytes (128 bits), as shown below:
$ sudo cat /sys/kernel/debug/tracing/events/syscalls/sys_enter_execve/format

name: sys_enter_execve
ID: 817
format:
	field:unsigned short common_type;	offset:0;	size:2;	signed:0;
	field:unsigned char common_flags;	offset:2;	size:1;	signed:0;
	field:unsigned char common_preempt_count;	offset:3;	size:1;	signed:0;
	field:int common_pid;	offset:4;	size:4;	signed:1;

	field:int __syscall_nr;	offset:8;	size:4;	signed:1;
	field:const char * filename;	offset:16;	size:8;	signed:0;
	field:const char *const * argv;	offset:24;	size:8;	signed:0;
	field:const char *const * envp;	offset:32;	size:8;	signed:0;

print fmt: "filename: 0x%08lx, argv: 0x%08lx, envp: 0x%08lx", ((unsigned long)(REC->filename)), ((unsigned long)(REC->argv)), ((unsigned long)(REC->envp))
With this structure, we can now cast the raw context pointer to struct exec_params_t *, making it easy to read the syscall arguments directly, in this case, the filename argument from the execve syscall.
The main tracepoint handler is now updated to reserve space in the ring buffer and emit a structured event:
SEC("tracepoint/syscalls/sys_enter_execve")
int handle_execve(struct exec_params_t *params) {
  struct task_struct *task = (struct task_struct*)bpf_get_current_task();
  struct exec_evt *evt = {0};

  evt = bpf_ringbuf_reserve(&rb, sizeof(*evt), 0);
  if (!evt) {
    bpf_printk("Ring Buffer not reserved\n");
    return 1;
  }

  evt->pid = BPF_CORE_READ(task, pid);
  evt->tgid = BPF_CORE_READ(task, tgid);
  bpf_get_current_comm(&evt->comm, sizeof(evt->comm));
  bpf_probe_read_user_str(&evt->file, sizeof(evt->file), params->file);
  bpf_ringbuf_submit(evt, 0);
  bpf_printk("Exec called!\n");
  return 0;
}
Instead of logging only, we now create an exec_evt structure (defined in exec.h) to store useful metadata: the process ID, thread group ID, command name, and the filename passed to execve. These are safely read using BPF_CORE_READ() and bpf_probe_read_user_str() to ensure compatibility with different kernel versions and avoid unsafe user memory access.
BPF_CORE_READ() is a CO-RE feature that extracts struct fields with awareness of kernel BTF info. This allows the program to work across different kernel versions without recompilation, as long as BTF is available.
Finally, we still log a message with bpf_printk() for quick verification or debugging:
bpf_printk("Exec called!\n");
User-space code update
Here is the final version of exec.c:
#include <stdio.h>
#include <stdlib.h>

#include "exec.skel.h"
#include "exec.h"

static int handle_evt(void *ctx, void *data, size_t sz) {
  const struct exec_evt *evt = data;
  fprintf(stdout, "  [TGID: %-5d] [PID: %-5d] [Comm: %-15s] [File: %-40s]\n", evt->tgid, evt->pid, evt->comm, evt->file);
  return 0;
}

int main(void) {
  struct exec *skel = exec__open();
  exec__load(skel);
  exec__attach(skel);

  struct ring_buffer *rb = ring_buffer__new(bpf_map__fd(skel->maps.rb), handle_evt, NULL, NULL);

  for (;;) {
    ring_buffer__poll(rb, 1000);
  }

  return 0;
}
We started from a program that simply loads and attaches the eBPF program using the BPF skeleton structure:
#include "exec.skel.h"

int main(void) {
  struct exec *skel = exec__open();
  exec__load(skel);
  exec__attach(skel);

  for (;;) {}

  return 0;
}
This version is minimal and focuses purely on setting up and running the eBPF program. It opens the exec BPF program using the generated skeleton (exec__open()), loads it into the kernel (exec__load()), and attaches it to the appropriate tracepoints (exec__attach()). The program then enters an infinite loop to keep running, but it does not handle any events or interact with the data from the kernel. It’s essentially a base for observing kernel behavior without any further output.
The second code snippet below introduces significant changes for handling the data generated by the eBPF program:
#include <stdio.h>
#include <stdlib.h>
#include "exec.skel.h"
#include "exec.h"

static int handle_evt(void *ctx, void *data, size_t sz) {
  const struct exec_evt *evt = data;
  fprintf(stdout, "  [TGID: %-5d] [PID: %-5d] [Comm: %-15s] [File: %-40s]\n", evt->tgid, evt->pid, evt->comm, evt->file);
  return 0;
}

int main(void) {
  struct exec *skel = exec__open();
  exec__load(skel);
  exec__attach(skel);

  struct ring_buffer *rb = ring_buffer__new(bpf_map__fd(skel->maps.rb), handle_evt, NULL, NULL);

  for (;;) {
    ring_buffer__poll(rb, 1000);
  }

  return 0;
}
In this version, we now handle the data coming from the kernel through the ring buffer. The primary change here is the introduction of the ring_buffer__new() call, which creates a new ring buffer object for reading the events emitted by the eBPF program. This is where the data collected by the eBPF program (such as process ID, thread group ID, command name, and file path) is stored and can be retrieved by the user-space application.
struct ring_buffer *rb = ring_buffer__new(bpf_map__fd(skel->maps.rb), handle_evt, NULL, NULL);
The handle_evt() function is introduced as the callback for processing the data in the ring buffer. Each time an event is retrieved from the kernel, this function is called, and it prints the data in a human-readable format. The data argument of handle_evt() is a pointer to the event structure (struct exec_evt), and the function casts it appropriately before using the data.
static int handle_evt(void *ctx, void *data, size_t sz) {
  const struct exec_evt *evt = data;
  fprintf(stdout, "  [TGID: %-5d] [PID: %-5d] [Comm: %-15s] [File: %-40s]\n", evt->tgid, evt->pid, evt->comm, evt->file);
  return 0;
}
Next, the program enters a loop where it continuously polls the ring buffer for new events. The ring_buffer__poll() function is used for this, which checks for new data in the ring buffer every 1000 milliseconds.
for (;;) {
  ring_buffer__poll(rb, 1000);
}
This loop ensures that the user-space application remains active and processes events as long as they are available, effectively providing continuous monitoring of the execve syscalls in the system.
The key changes in this second version are:
- Event Handling: Instead of just loading and attaching the eBPF program, the second version processes the events generated by the program using a ring buffer. This allows the user-space program to receive and handle structured data from the kernel in real time.
- Ring Buffer Integration: By using
ring_buffer__new()andring_buffer__poll(), the second version efficiently manages the flow of events from the kernel to user space, decoupling the event generation (in the kernel) from event processing (in user space). - Data Structure and Display: The
handle_evt()function is introduced to format and display the data, making it easy to interpret the events, such as showing the process ID, thread group ID, command name, and file path of the executed program.
This updated approach is much more powerful, as it allows for structured communication between the kernel and user-space programs and ensures that the user-space program can process and display real-time data generated by the kernel via the eBPF program.
Conclusion
And there you have it! You’ve just created a minimal yet powerful eBPF program that can track process invocations, all without the need for kernel modules. The beauty of this setup is in its simplicity and portability, thanks to libbpf and CO-RE. With just a few lines of code and some clever tools, you’ve tapped into the heart of system-level monitoring. So go ahead, start experimenting, and remember: this is just the beginning, the world of eBPF is wide, wild, and full of potential.
References
- https://www.youtube.com/watch?v=-IGReOYExqo
- https://www.sartura.hr/blog/simple-ebpf-core-application/
- https://github.com/libbpf/libbpf
- https://liuhangbin.netlify.app/post/bpf-skeleton/
- https://thegraynode.io/posts/bpf_bpftool/
This blog post is licensed under
CC BY-SA 4.0


