A Byte-wise Understanding of eBPF CO-RE
May 8, 2026 by Zacharia Mansouri | 3100 views
https://cylab.be/blog/506/a-byte-wise-understanding-of-ebpf-co-re
eBPF has revolutionized Linux kernel tracing and security by allowing user-space programs to safely execute in kernel space, but its power has historically been limited by strict kernel version dependencies. When a kernel structure changes between updates, hardcoded memory offsets break, leading to crashes or silent failures. To overcome this fragility, the ecosystem introduced BPF Type Format and Compile Once Run Everywhere, an elegant mechanism that dynamically patches memory offsets at runtime. In this post, we will dissect exactly how this memory patching works at the bare-metal level, tracking the journey of a payload from raw hex dumps of a compiled object file all the way down to live machine code executing in ring zero.
What is the BPF Type Format
To put it simply, BPF Type Format (BTF) is a highly compressed and optimized version of debugging information. If you have ever written C or C++ and compiled it with debug symbols (-g), the compiler usually embeds DWARF data. DWARF give the debugger information such as the type of a variable and at which offset it lies into a struct. However, DWARF is massive and far too inflated to load directly into the Linux kernel.
BTF was created to solve this. It strips away all the unnecessary metadata and leaves only the absolute essentials:
- The existing structs.
- The fields inside those structs, and their byte offsets.
- The signatures of the functions present in an eBPF program.
- The mapping of bytecode instructions to original C source lines.
When you compile an eBPF program, the BTF data is packed into the .BTF section of the produced ELF file. Additionally, modern Linux kernels are compiled with BTF, exposed at /sys/kernel/btf/vmlinux.
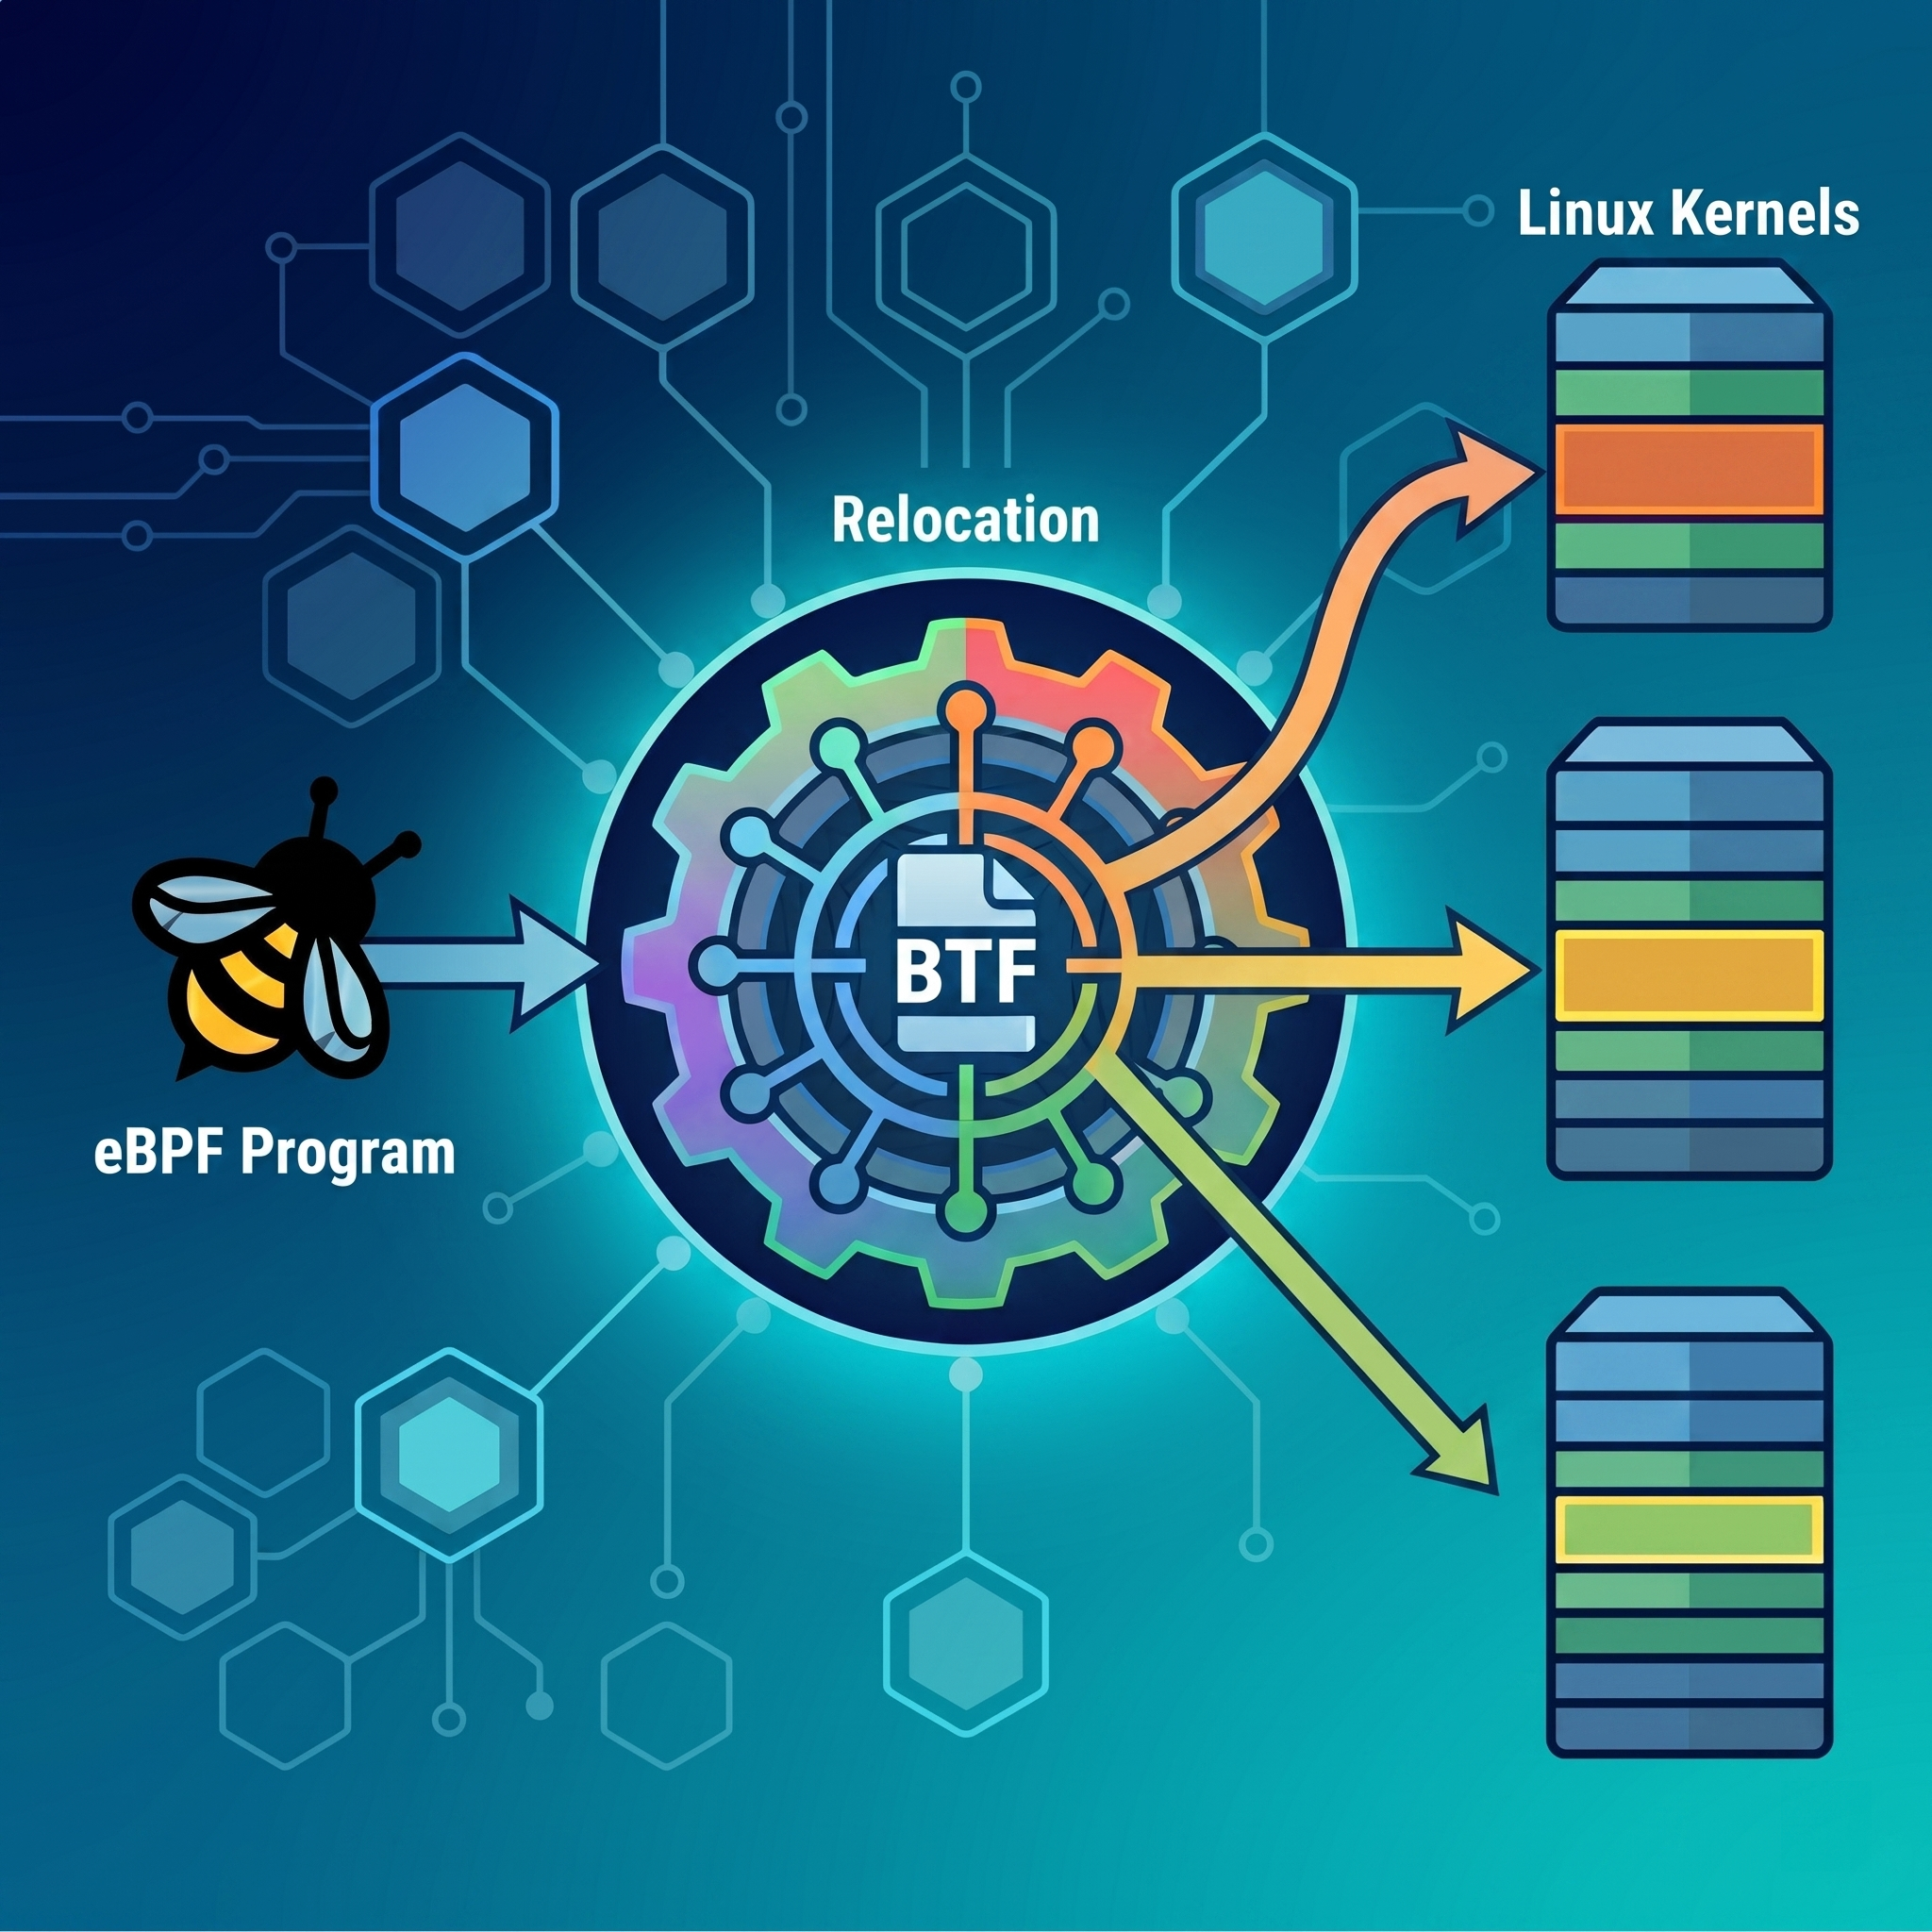
The BTF and CO-RE Relationship
BTF is the spine that makes Compile Once – Run Everywhere (CO-RE) possible.
Before CO-RE, if your eBPF program read a struct access like task->pid, the clang compiler would hardcode a memory offset. It would compile an instruction saying: read exactly x bytes past the start of the task pointer. If you ran that compiled object on a newer kernel where the developers added a new field to task_struct, the pid might now be at offset x + 8. Your program would read garbage data or crash.
Here is how BTF fixes this:
- The Placeholder: when you compile a CO-RE program,
clangdoesn’t hardcode the offset ofpid. Instead, it inserts a placeholder instruction and writes a note into the.BTF.extsection. - The Relocation Record: that note (named the
core_relorecord) informs the loader: at instruction numberi, I am trying to read the field namedpidfrom the struct namedtask_struct. - The Matchmaker: when your loader (e.g.
libbpf) tries to load the program into a new machine, it reads the.BTF.extrecords from your binary, and compares them against the kernel’s BTF at/sys/kernel/btf/vmlinux. - The Patch: the loader finds where
pidactually lives in this specific kernel version, patches the placeholder instruction in your bytecode with the correct offset, and then hands it to the eBPF verifier.
Additional notes:
- CO-RE is not a feature of the eBPF virtual machine. It is a memory-patching trick performed by the user-space loader, and BTF is the dictionary it uses to translate the fields.
- If you need to setup a program using eBPF CO-RE, we have that in stock too!
The .BTF.ext Header
The .BTF.ext section stores all the non‑type metadata used by BPF, specifically function info, line info, and CO‑RE relocation records.
Every .BTF.ext section begins with a strictly defined header. Here is the C structure defining that 32-byte header directly from the kernel code at tools/lib/bpf/btf.h:
struct btf_ext_header {
    __u16   magic;
    __u8    version;
    __u8    flags;
    __u32   hdr_len;

    /* All offsets are in bytes relative to the end of this header */
    __u32   func_info_off;
    __u32   func_info_len;
    __u32   line_info_off;
    __u32   line_info_len;

    /* optional part of .BTF.ext header */
    __u32   core_relo_off;
    __u32   core_relo_len;
};
Below are described those fields:
magic: always set to0xeb9f. This is how tools such asreadelfandbpftoolknow they are looking at the right section.version: currently set to1.hdr_len: the size of this header (usually32bytes, or0x20).func_info_*: where the function signature mappings live and their size.line_info_*: where the source code/bytecode mappings live and their size.core_relo_*: where the CO-RE relocations live and their size.
Reading the .BTF.ext Hex Dump
To determine whether an eBPF program contains CO‑RE relocation data, we can inspect the .BTF.ext section. This section begins with the 32‑byte btf_ext_header structure we just saw, describing the layout of the CO‑RE metadata.
Dump the section:
$ readelf -x .BTF.ext your_object_file.o

Hex dump of section '.BTF.ext':
  0x00000000 9feb0100 20000000 00000000 14000000 .... ...........
  0x00000010 14000000 6c000000 80000000 00000000 ....l...........
The last 4 bytes of this 32‑byte header (offset 0x1c-0x1f) correspond to the field core_relo_len, which represents the total size in bytes of the CO‑RE relocation entries. Its values here is 0. Here is how to interpret the value of core_relo_len:
- If
core_relo_len == 0, the object file does not contain CO‑RE relocations. This means the program does not use CO‑RE mechanisms, but it does not imply that the program is automatically portable or that it relies only on stable UAPI structures. But note that, if your program only touches structures defined in UAPI headers, you don’t need CO‑RE since these structures are part of the stable userspace ABI, since as Linux founder stated: WE DO NOT BREAK USERSPACE! - If
core_relo_len > 0, the object file contains CO‑RE relocation entries. This means the program uses CO‑RE features, which improve portability for kernel internal structure accesses that use CO‑RE macros.
When CO-RE is Active
In order to better understand CO-RE at a low level, we’ll be using nothing but a hex reader and the clang compiler’s output of a BPF program object file. Let’s examine an eBPF malware payload designed to hook the sys_openat syscall to fake a full disk, taken from this blog post.
Proving the Payload is CO-RE Enabled
We begin by dumping the header of the .BTF.ext section that contains the action plan for the eBPF loader:
$ readelf -x .BTF.ext program.bpf.o

Hex dump of section '.BTF.ext':
  0x00000000 9feb0100 20000000 00000000 14000000 .... ...........
  0x00000010 14000000 0c010000 20010000 3c000000 ........ ...<...
The 32-byte header ends at offset 0x1f. We look at the final four bytes: 3c000000. Correcting for Little Endian, this is 0x0000003c (60 bytes). Because core_relo_len is greater than zero, we have the proof that this binary contains 60 bytes of active CO-RE patching instructions.
Locating the Action Plan
To find the exact location of those 60 bytes of CO-RE data, we calculate the offset from the .BTF.ext header:
- Header Length (
hdr_len):0x20(32 bytes) - CO-RE Offset (
core_relo_off):20010000➔0x0120
Because offsets within the .BTF.ext section are relative to the end of the header as commented in the btf_ext_header struct definition, the CO-RE data begins at 0x20 + 0x0120 = 0x0140. Let’s jump to that exact memory address and parse the raw bytes using the bpf_core_relo struct definition from /include/uapi/linux/btf.h.
struct bpf_core_relo {
	__u32 insn_off;       // Which instruction index to patch
	__u32 type_id;        // The BTF type ID of the struct (e.g., task_struct)
	__u32 access_str_off; // Offset to the string "0:14" (meaning the field)
	__u32 kind;           // What kind of relocation (usually 0 for field offset)
};
Parsing the Action Plan
To understand how the malware is parsed, we jump directly to the CO-RE data block. Here is the raw memory exactly as it appears on disk:
  0x00000140 10000000 a5000000 03000000 08000000 ................
  0x00000150 0a000000 27010000 00000000 10000000 ....'...........
  0x00000160 0a000000 6d010000 00000000 48000000 ....m.......H...
  0x00000170 0a000000 a9010000 00000000 ........ ............
The first 12 bytes (0x140 to 0x14b) define the program block header (Little Endian):
10000000(16 bytes): the size of each CO-RE record.a5000000(0xa5): the string offset for the program’s name (kprobe/__x64_sys_openat).03000000(3 relocations): the number of memory-patching rules we need to process.
Immediately following those 12 bytes, the three 16-byte relocation records begin. To map the malware’s behavior, we look at the bpf_core_relo defined above and care about two specific fields in each record: the instruction offset (insn_off) and the access string offset (access_str_off).
When clang compiles a CO-RE program, it doesn’t know the target kernel’s memory layout yet. It inserts placeholder instructions into the eBPF bytecode. The insn_off is the exact byte coordinate of that dummy instruction. The loader uses this coordinate to find the dummy instruction in memory and overwrite it with the real offset before executing it. The register targets shown here are only hints. Later on, we’ll explain how they were actually identified.
- Relocation #1 (targeting the
diregister)- Instruction Offset (
0x014c): raw08000000→0x08- BPF instructions are 8 bytes each:
0x08 / 8 = 1→ instruction index 1 (the 2nd instruction)
- BPF instructions are 8 bytes each:
- String Offset (
0x0154): raw27010000→0x0127
- Instruction Offset (
- Relocation #2 (targeting the
siregister)- Instruction Offset (
0x015c): raw10000000→0x100x10 / 8 = 2→ instruction index 2 (the 3rd instruction)
- String Offset (
0x0164): raw6d010000→0x016d
- Instruction Offset (
- Relocation #3 — targeting the
dxregister- Instruction Offset (
0x016c): raw48000000→0x480x48 / 8 = 9→ instruction index 9 (the 10th instruction)
- String Offset (
0x0174): rawa9010000→0x01a9
- Instruction Offset (
Consulting the Dictionary
The compiler has generated three strict rules for our eBPF program. We now have the instruction coordinates, and the string offsets telling the loader what to look for: 0x0127, 0x016d, and 0x01a9.
These values are pointers to the language of CO-RE. To translate them into readable text, we switch over to the standard .BTF section, which acts as the global String Table. By inspecting the .BTF header, we can see that its string table begins at offset 0x0260.
This value comes from the str_off field in the btf_header structure, which defines the header layout for the .BTF section (as specified in include/uapi/linux/btf.h).
struct btf_header {
    __u16   magic;
    __u8    version;
    __u8    flags;
    __u32   hdr_len;

    /* All offsets are in bytes relative to the end of this header */
    __u32   type_off;
    __u32   type_len;
    __u32   str_off;
    __u32   str_len;
};
By simply adding the String Table base offset to our three pointers, we calculate the exact memory addresses of the access strings the malware uses:
- Target 1 (
di):0x0260 + 0x0127=0x0387 - Target 2 (
si):0x0260 + 0x016d=0x03cd - Target 3 (
dx):0x0260 + 0x01a9=0x0409
Let’s look at the raw hex and ASCII dump of the .BTF dictionary at those exact coordinates. Because clang packs the C source code into the dictionary alongside the CO-RE strings, we can see the exact correlation between the bytes, the strings, and the developer’s original code:
$ readelf -x .BTF program.bpf.o

  // TARGET 1 (0x0387) -> String "0:14"
  0x00000380 202a6374 78290030 3a313400 20202020  *ctx).0:14.
  0x00000390 73747275 63742070 745f7265 6773202a struct pt_regs *
  0x000003a0 72656773 203d2028 73747275 63742070 regs = (struct p
  0x000003b0 745f7265 6773202a 2950545f 52454753 t_regs *)PT_REGS
  0x000003c0 5f504152 4d312863 7478293b 00303a31 _PARM1(ctx);.0:1

  // TARGET 2 (0x03cd) -> String "0:13"
  0x000003c0 ...                              31             .0:1
  0x000003d0 33002020 2020666e 616d655f 70747220 3.    fname_ptr
  0x000003e0 3d202863 6f6e7374 20636861 72202a29 = (const char *)
  0x000003f0 4250465f 434f5245 5f524541 44287265 BPF_CORE_READ(re
  0x00000400 67732c20 7369293b 00303a31 32002020 gs, si);.0:12.

  // TARGET 3 (0x0409) -> String "0:12"
  0x00000400 ...                              20         .0:12.
  0x00000410 2020666c 61677320 3d202869 6e742942   flags = (int)B
  0x00000420 50465f43 4f52455f 52454144 28726567 PF_CORE_READ(reg
  0x00000430 732c2064 78293b00 20202020 69662028 s, dx);.    if (
The Translation (Hex to Kernel Architecture)
We now know the malware’s three CO-RE action plans are pointing to "0:14", "0:13", and "0:12". But what do those numbers mean?
The first number (0) means: start at the base of the struct. The second number is the field index. By looking at the pt_regs struct definition in the x86 Linux kernel headers (arch/x86/include/asm/ptrace.h), the translation becomes crystal clear:
struct pt_regs {
    // ... skipping 0:0 through 0:10
    unsigned long cx;       // 0:11
    unsigned long dx;       // 0:12 <-- TARGET 3: Syscall Arg 3 (flags)
    unsigned long si;       // 0:13 <-- TARGET 2: Syscall Arg 2 (filename)
    unsigned long di;       // 0:14 <-- TARGET 1: Syscall Arg 1 (dfd/saved regs)
    unsigned long orig_ax;  // 0:15
    // ...
};
This byte-trace perfectly aligns with the malware C code . The compiler successfully translated high-level macros into an architectural map:
// Compiles to: Relocation #1 -> "0:14" (Find 'di' to get the saved registers)
struct pt_regs *regs = (struct pt_regs *)PT_REGS_PARM1(ctx);

// Compiles to: Relocation #2 -> "0:13" (Find 'si' to get the filename pointer)
fname_ptr = (const char *)BPF_CORE_READ(regs, si);

// Compiles to: Relocation #3 -> "0:12" (Find 'dx' to get the O_CREAT/O_WRONLY flags)
flags = (int)BPF_CORE_READ(regs, dx);
By manually traversing the ELF sections, performing offset arithmetic, and mapping the results to the kernel source, we have completely reverse-engineered the program’s dynamic memory patching requirements.
JIT Compilation and Live Memory Inspection
The journey of our payload does not end at the verifier. Once the eBPF subsystem accepts libbpf’s dynamically mutated byte array, the payload must be mapped into protected kernel memory.
To achieve bare-metal performance, modern Linux kernels do not interpret eBPF bytecode at runtime. Instead, they pass the verified bytecode through the Just-In-Time (JIT) Compiler. The JIT compiler translates our patched eBPF virtual machine instructions directly into native x86_64 machine code (depending on the architecture of your CPU), locks it into an executable memory page, and wires it to the sys_openat kernel probe.
At this stage, the original ELF file on disk is completely irrelevant. The malware lives entirely in RAM. To prove that our CO-RE offsets survived this entire journey and are currently executing in ring 0, we must extract the program directly from kernel memory.
Locating the Live Payload
The Swiss Army knife for eBPF memory inspection is bpftool. After our program has been successfully run, we can ask the kernel to list all currently active eBPF programs.
$ sudo ./bpftool prog show

...
218: kprobe  name inject_disk_full  tag 28bbec15d36984d9  gpl
    loaded_at 2026-05-07T11:27:34+0200  uid 0
    xlated 480B  jited 335B  memlock 4096B
    btf_id 119
    pids program(40140)
The kernel has assigned our malware the ID 218. Notice the memory footprint: the payload takes exactly 480 bytes of translated eBPF instructions (xlated) and has been compressed by the JIT compiler into just 335 bytes of pure x86_64 machine code (jited).
Dumping the Translated Bytecode (xlated)
We can use this ID to dump the exact eBPF bytecode that the kernel has stored in memory. This represents the state of the program after libbpf has patched it and the verifier has processed it, but before native x86_64 translation.
$ sudo ./bpftool prog dump xlated id 218

int inject_disk_full(struct pt_regs * ctx):
; struct pt_regs *regs = (struct pt_regs *)PT_REGS_PARM1(ctx);
   1: (79) r8 = *(u64 *)(r6 +112)

... (setup for reading 'si') ...
; fname_ptr = (const char *)BPF_CORE_READ(regs, si);
   7: (b7) r2 = 8
   8: (85) call bpf_probe_read_kernel#-69136

... (setup for reading 'dx') ...
   9: (b7) r1 = 96
  10: (0f) r8 += r1
; flags = (int)BPF_CORE_READ(regs, dx);
  14: (b7) r2 = 8
  15: (bf) r3 = r8
  16: (85) call bpf_probe_read_kernel#-69136
Here we see the reality of how CO-RE macros expand in a production environment.
First, look at instruction 1. The program reads the di register from the kprobe context to get the saved pt_regs. Because di is the 14th 64-bit field in the struct (14 * 8 bytes), the CO-RE loader successfully patched the instruction to read exactly at offset 112.
Next, look at instructions 9 through 16. The BPF_CORE_READ macro does not blindly dereference memory, because doing so on an invalid kernel pointer would trigger a kernel panic. Instead, the macro expands into a safe bpf_probe_read_kernel() helper call. But notice instruction 9: the dynamic CO-RE offset we calculated earlier, 96 (for the dx register), is hardcoded right into the eBPF register r1. The verifier simply sees a safe memory read of 8 bytes from a pointer offset by 96.
Extracting the Native Machine Code (jited)
The eBPF bytecode is still just an abstraction. The ultimate source of truth is the actual CPU execution context.
We instruct bpftool to dump the raw x86_64 assembly generated by the JIT compiler. This is the literal machine code executing on the processor every time a user on the compromised system opens a file.
$ sudo ./bpftool prog dump jited id 218

[bpf_prog_28bbec15d36984d9_inject_disk_full:
   0:    nopl    (%rax,%rax)
   5:    nop
   7:    pushq   %rbp
   8:    movq    %rsp, %rbp
   ...
; struct pt_regs *regs = (struct pt_regs *)PT_REGS_PARM1(ctx);
  1a:    movq    112(%rbx), %r14
  1e:    movl    $104, %edi
  23:    movq    %r14, %rdx
  26:    addq    %rdi, %rdx
  ...
; fname_ptr = (const char *)BPF_CORE_READ(regs, si);
  30:    movl    $8, %esi
  35:    callq   0xffffffff8a438c30
  3a:    movl    $96, %edi
  3f:    addq    %rdi, %r14
  ...
; flags = (int)BPF_CORE_READ(regs, dx);
  4d:    movl    $8, %esi
  52:    movq    %r14, %rdx
  55:    callq   0xffffffff8a438c30]([]())
Here, at instructions 1a, 1e, and 3a, we witness the final physical manifestation of Compile Once - Run Everywhere.
The JIT compiler has mapped the struct setups into heavily optimized x86 assembly.
- At
1a, it retrieves theregspointer using the CO-RE offset of112. - At
1e, it moves$104into%edito set up the read for thesiregister. - At
3a, it moves$96into%edito set up the read for thedxregister.
Finally, at 35 and 55, it issues native x86_64 callq instructions to the absolute memory address 0xffffffff8a438c30, the location of the bpf_probe_read_kernel function residing in the target kernel’s memory space.
Conclusion
By manually tracing the byte-level structures from the compiled ELF file down to the processor’s actual execution context, the architectural interest of eBPF CO-RE becomes evident. What begins as a set of dummy instructions and offset pointers in user-space is seamlessly mutated by the loader to perfectly match the target environment before the kernel verifier even sees it. Ultimately, the JIT compiler bakes these dynamically calculated offsets into pure native assembly, allowing a single compiled payload to transparently hook completely unknown kernel versions without requiring source code or local compilation on the victim machine.
References
- https://docs.ebpf.io/concepts/core/
- https://docs.kernel.org/6.7/bpf/btf.html#btf-ext-section
- https://elixir.bootlin.com/linux/v7.0.3/source/include/uapi/linux/bpf.h
- https://github.com/libbpf/libbpf/blob/master/include/uapi/linux/bpf.h
- https://elixir.bootlin.com/linux/v5.15.173/source/arch/x86/include/asm/ptrace.h
This blog post is licensed under
CC BY-SA 4.0


