Compute the code coverage of your tests with java and maven
Sep 18, 2020 by Thibault Debatty | 13762 views
https://cylab.be/blog/94/compute-the-code-coverage-of-your-tests-with-java-and-maven
So you have a java project, and Junit tests. But which lines of your code are correctly tested, and more importantly, which lines are not tested?
To find the answer, we will use the jacoco maven plugin. This plugin offers different goals. The most interesting ones are:
- report : creates a code coverage report in different formats (HTML, XML, and CSV) that indicates precisely which lines are covered by a test, and which one are not;
- check : checks that some code coverage metrics are being met, for example that at least 80% of code lines are tested.
Coverage report
So, to generate automatically a code coverage report at each execution of the maven verify phase, we have to add the following definition to pom.xml (in the <build><plugins> section):
<plugin>
  <groupId>org.jacoco</groupId>
  <artifactId>jacoco-maven-plugin</artifactId>
  <version>0.8.5</version>
  <executions>
    <!-- to avoid bugs in some situations -->
    <execution>
      <id>default-prepare-agent</id>
      <goals>
        <goal>prepare-agent</goal>
      </goals>
    </execution>

    <!-- create report during maven verify phase -->
    <execution>
      <id>report</id>
      <phase>verify</phase>
      <goals>
        <goal>report</goal>
      </goals>
    </execution>
  </executions>
</plugin>
There is one caveat here: you have to manually add the prepare-agent execution goal. Normally it is not required, but you may run into weird bugs if you fail to do it…
From now, each time the maven verify phase is executed (so after integration tests, if you have some) the jacoco report will be produced in target/site/jacoco.
mvn clean verify
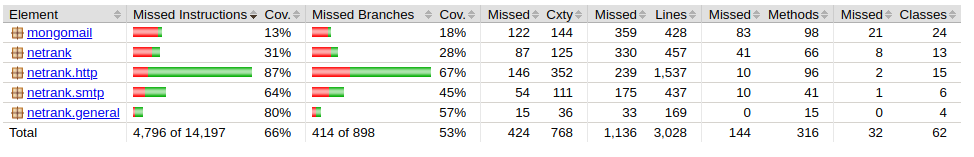
This report is very detailed, and shows precisely which lines are not tested in your project.

Coverage check
It is also possible to run an automatic check, and fail the build if some coverage rule is not met, by adding the following execution definition to the plugin:
<!-- check coverage during maven verify phase -->
<execution>
    <id>check</id>
    <goals>
        <goal>check</goal>
    </goals>
    <configuration>
        <rules>
            <rule>
                <element>BUNDLE</element>
                <limits>
                    <limit>
                        <counter>LINE</counter>
                        <value>COVEREDRATIO</value>
                        <minimum>0.8</minimum>
                    </limit>
                </limits>
            </rule>
        </rules>
    </configuration>
</execution>
The check goal requires to define some rules. The complete list of possible rules is available on the website of jacoco: https://www.jacoco.org/jacoco/trunk/doc/check-mojo.html#rules
GitLab badge
If you are using GitLab to manage your code and perform continuous integration, you can also create a nice badge that shows the code coverage of the tests in your project. However there is another trick here: GitLab creates the badge by applying a regular expression to the output (stdout or sterr) of your build job, but jacoco does NOT print a summary of the code coverage.
So you first have to add the following script to your project (in jacoco-summary.sh, and don’t forget to make it executable):
#!/bin/bash

##
## jacoco-summary.sh
## Parse jacoco.csv and print a summary (similar to phpunit) on stdout
## https://cylab.be/blog/94/compute-the-code-coverage-of-your-tests-with-java-and-maven
## requires gawk (GUN awk)
##

if [ "$#" -ne 1 ]; then
  echo "Print a summary of jacoco code coverage analysis."
  echo "Usage: $0 <path/to/jacoco.csv>";
  exit 1;
fi

awk -F ',' '{
  inst += $4 + $5;
  inst_covered += $5;
  br += $6 + $7;
  br_covered += $7;
  line += $8 + $9;
  line_covered += $9;
  comp += $10 + $11;
  comp_covered += $11;
  meth += $12 + $13;
  meth_covered += $13; }
END {
  print "Code Coverage Summary:";
  printf "  Instructions: %.2f% (%d/%d)
", 100*inst_covered/inst, inst_covered, inst;
  printf "  Branches:     %.2f% (%d/%d)
", 100*br_covered/br, br_covered, br;
  printf "  Lines:        %.2f% (%d/%d)
", 100*line_covered/line, line_covered, line;
  printf "  Complexity:   %.2f% (%d/%d)
", 100*comp_covered/comp, comp_covered, comp;
  printf "  Methods:      %.2f% (%d/%d)
", 100*meth_covered/meth, meth_covered, meth; }
' $1
Then you can add the following job to your .gitlab-ci.yml
test:coverage:
image: maven:3.5.3-jdk-11
script:
# Build & test project
- mvn clean verify
# extract code coverage from jacoco.csv
- apt update && apt install -y gawk
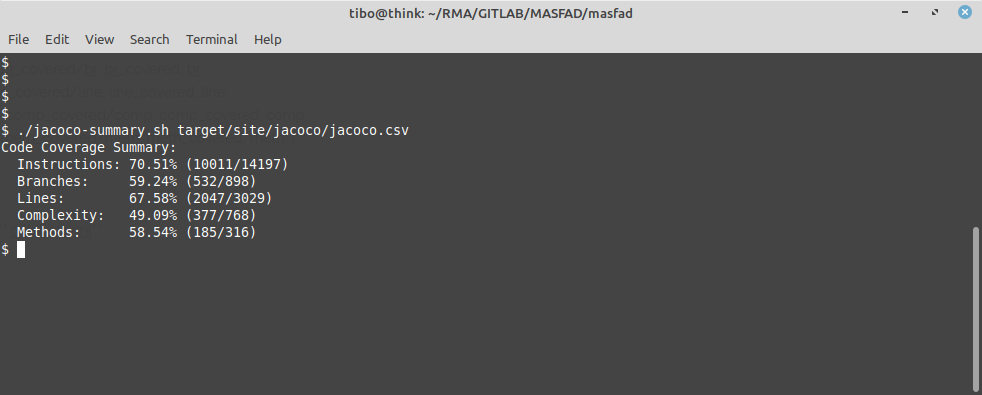
- ./jacoco-summary.sh target/site/jacoco/jacoco.csv
# Use this regular expression to create the badge.
coverage: '/^s*Instructions:s*d+.d+\%/'
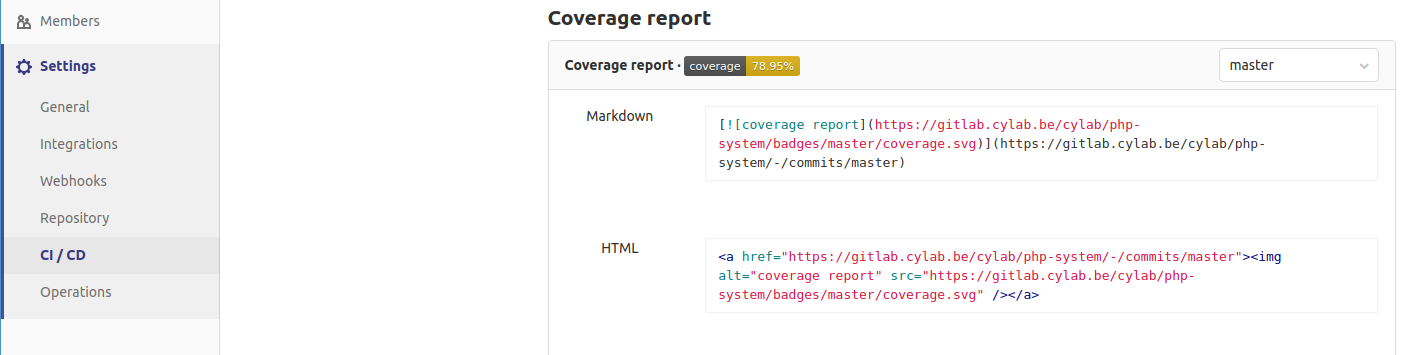
Finally, you can find the markdown or HTML code to show you code coverage under Settings > CI/CD > General pipelines. Add this code to your README, and your are done…
This blog post is licensed under
CC BY-SA 4.0


