Dump the memory of a VirtualBox VM for Volatility3
Dec 2, 2024 by Thibault Debatty | 3248 views
https://cylab.be/blog/99/dump-the-memory-of-a-virtualbox-vm-for-volatility3
We are increasingly relying on virtual machines (VM) to run our applications, especially with the current wave of cloud-based deployments. However, when a VM is compromised, it’s essential to extract and analyze the memory dump to identify potential threats and gather evidence. In this short blog post, I’ll show how to analyze the memory dump of a VirtualBox VM using Volatility3.
Prerequisites
To run these commands, you should have
- Volatility3 installed on your host machine;
- VirtualBox and a running VM.
Step 1 : list running machines
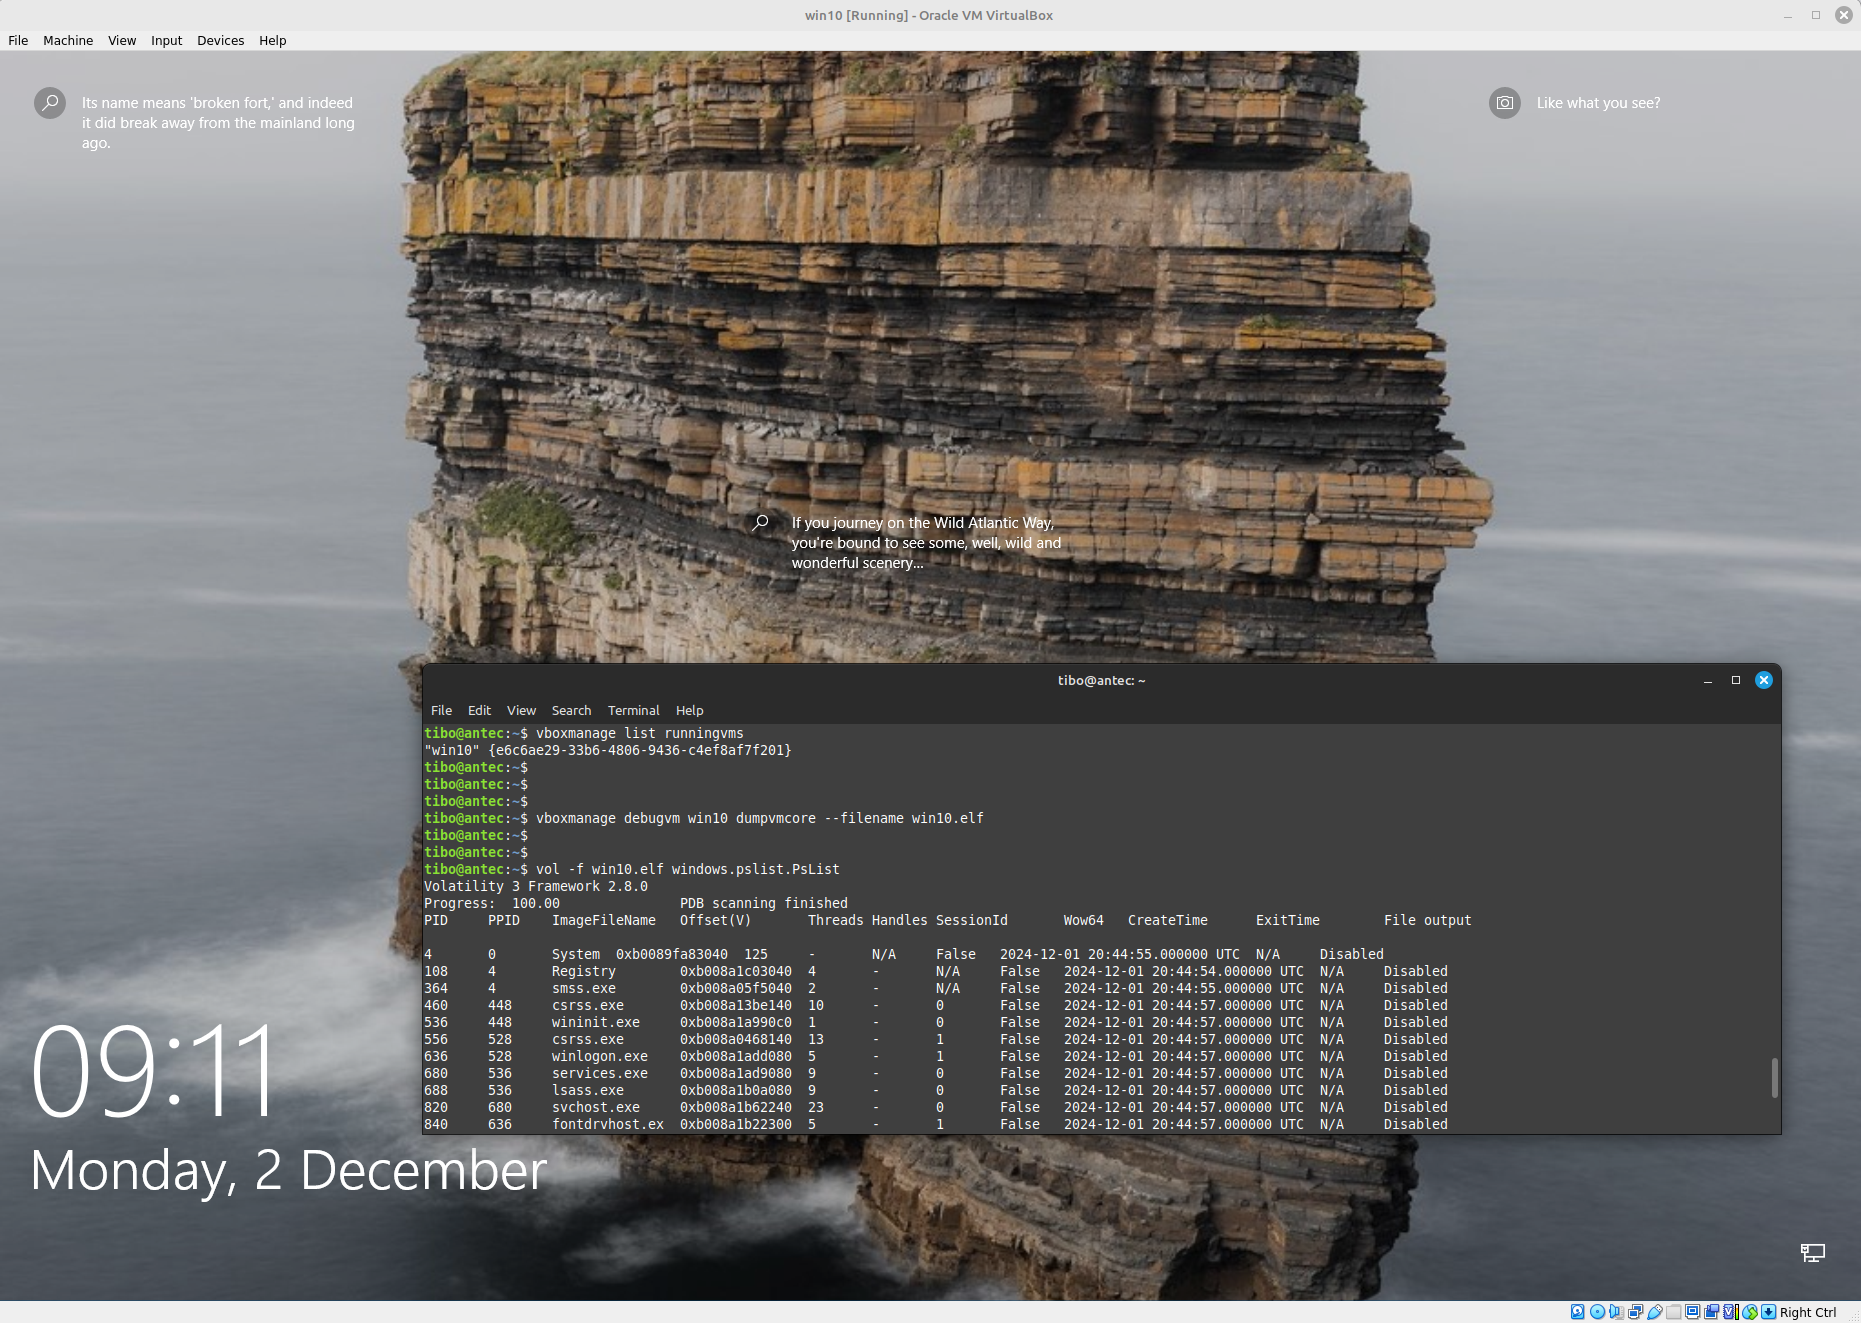
vboxmanage list runningvms
Step 2 : dump VM memory
vboxmanage debugvm <name or uuid> dumpvmcore --filename <filename>
For example
vboxmanage debugvm win10 dumpvmcore --filename win10.elf
The created file will have the standard ELF core format (with some custom sections).
[ ELF 64 Header]
[ Program Header, type PT_NOTE ]
  → offset to COREDESCRIPTOR
[ Program Header, type PT_LOAD ] - one for each contiguous physical memory range
  → Memory offset of range
  → File offset
[ Note Header, type NT_VBOXCORE ]
[ COREDESCRIPTOR ]
  → Magic
  → VM core file version
  → VBox version
  → Number of vCPUs etc.
[ Note Header, type NT_VBOXCPU ] - one for each vCPU
[ vCPU 1 Note Header ]
  [ DBGFCORECPU - vCPU 1 dump ]
[ Additional Notes + Data ] - currently unused
[ Memory dump ]
You can check VirtualBox documentation for more info
https://www.virtualbox.org/manual/ch12.html#ts_guest-core-format
Step 3 : analyse the image
vol -f win10.elf windows.pslist.PsList
This blog post is licensed under
CC BY-SA 4.0


