Use Loki to monitor the logs of your docker compose application
Oct 26, 2022 by Thibault Debatty | 35554 views
https://cylab.be/blog/241/use-loki-to-monitor-the-logs-of-your-docker-compose-application
Loki is a log database developed by Grafana Labs. It is similar to Elasticsearch, with some major conceptual differences:
- Loki has a very simple indexing system, that only indexes a few labels for every log line;
- Loki will compress the actual log lines before they are saved to disk.
This may seem quite simplistic, but the result is actually extremely effective: in a comparison based on 42GB of logs generated by Nginx, ELK consumed 107GB of disk space to store the data and index, while Loki consumed only 9GB!
https://crashlaker.medium.com/which-logging-solution-4b96ad3e8d21
In this blog post, we show how to use Loki to monitor the logs of an application deployed with docker-compose.
A typical Loki stack consists of:
- Loki itself, the log database (this would be the equivalent of Elasticsearch);
- Grafana, the visualization web interface (equivalent of Kibana);
- Promtail, that allows to scrape log files and send the logs to Loki (equivalent of Logstash).
As we will see below, Promtail can also be used to directly scrape logs from Docker containers.
docker-compose.yml
To use Loki in your docker-compose app, add the following services to your docker-compose.yml:
  #
  # loki stack
  # https://cylab.be/blog/241/use-loki-to-monitor-the-logs-of-your-docker-
  # compose-application
  #

  loki:
    image: grafana/loki:2.6.1
    ports:
      - "3100"
    volumes:
      # directory must be created first, with uid:gid 10001:10001
      - ./volumes/loki:/loki

  promtail:
    image: grafana/promtail:2.6.1
    volumes:
      # custom config will read logs from the containers of
      # this project
      - ./loki/promtail-config.yaml:/etc/promtail/config.yml
      # to read container labels and logs
      - /var/run/docker.sock:/var/run/docker.sock
      - /var/lib/docker/containers:/var/lib/docker/containers

  # will be available at http://127.0.0.1:3000
  # default credentials: admin/admin
  grafana:
    image: grafana/grafana:9.2.2
    ports:
      - "3000:3000"
    volumes:
      # directory must be created first, with uid:gid 472:472
      - ./volumes/grafana:/var/lib/grafana
      # automatically configure the loki datasource
      - ./loki/grafana/provisioning/:/etc/grafana/provisioning/
As you can see, we are using local volumes to store Loki and Grafana data. To make it work, we must first create the local directories and assign the correct uid:
mkdir -p ./volumes/loki
sudo chown 10001:10001 ./volumes/loki

mkdir -p ./volumes/grafana
sudo chown 472:472 ./volumes/grafana
Promtail
In the configuration above, we use volumes /var/run/docker.sock and /var/lib/docker/containers to give Promtail access to docker, and to all docker containers. By the way, this is a security issue in a shared environment…
Now we can configure Promtail to scrape the logs of Docker containers, but only for this app (docker compose project). Create the file ./loki/promtail-config.yaml with the following content. Don’t forget to replace the name of the project (myapp):
#
# configure promtail to scrape docker logs for a specific
# docker compose project
# https://cylab.be/blog/241/use-loki-to-monitor-the-logs-of-your-docker-
# compose-application
#

server:
  http_listen_port: 9080
  grpc_listen_port: 0

clients:
  - url: http://loki:3100/loki/api/v1/push

scrape_configs:
  - job_name: docker
    # use docker.sock to filter containers
    docker_sd_configs:
      - host: "unix:///var/run/docker.sock"
        refresh_interval: 15s
        filters:
          - name: label
            values: ["com.docker.compose.project=myapp"]
    # use container name to create a loki label
    relabel_configs:
      - source_labels: ['__meta_docker_container_name']
        regex: '/(.*)'
        target_label: 'container'
You can now define the name of your project (myapp in my example) at the beginning of your docker-compose.yml:
version: "3.7"

# set env variable COMPOSE_PROJECT_NAME and
# label com.docker.compose.project
name: myapp

services:
...
Grafana
Finally, we must configure Grafana to connect to our Loki database. Create the directory
mkdir -p ./loki/grafana/provisioning/datasources
And add the following content to loki/grafana/provisioning/datasources/loki.yml:
#
# automatically configure the loki datasource in grafana
# https://cylab.be/blog/241/use-loki-to-monitor-the-logs-of-your-docker-
# compose-application
#

apiVersion: 1

datasources:
  - name: Loki
    type: loki
    url: http://loki:3100
    isDefault: true
First steps
You can now start your containers:
docker compose up
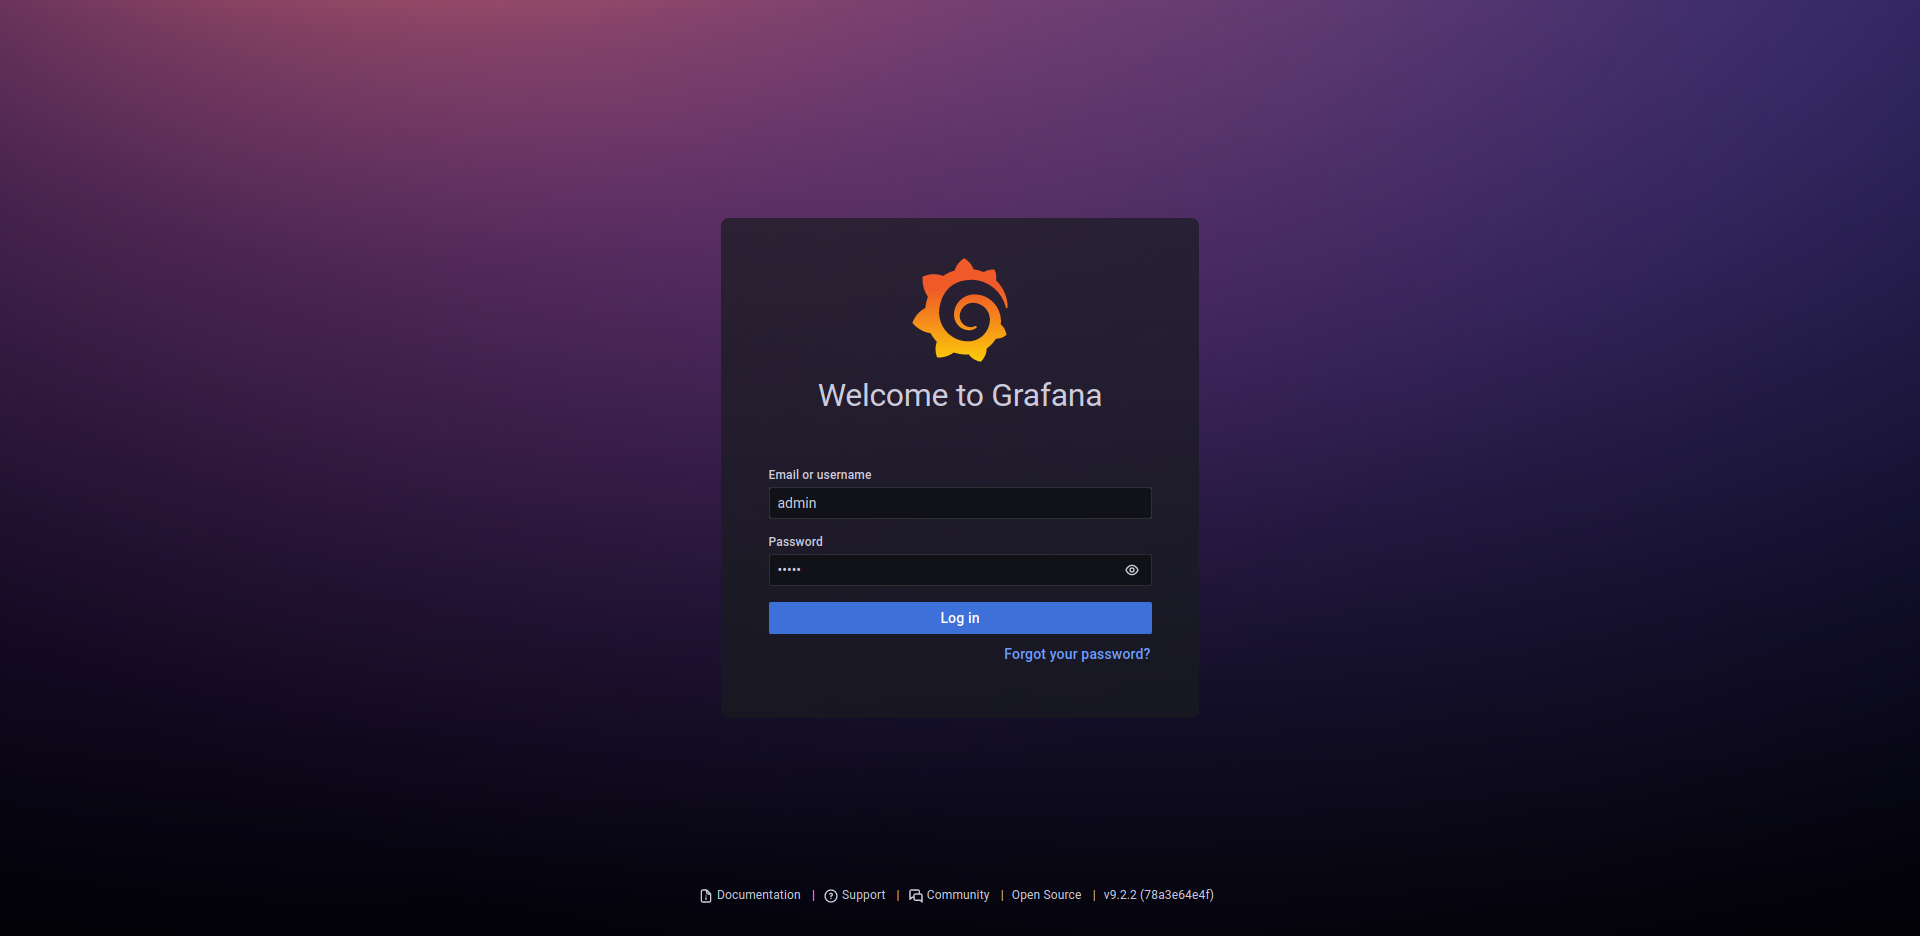
After a few seconds, all containers will be up and running, and the grafana web interface will be available at http://127.0.0.1:3000 with default credentials
- Username:
admin - Password:
admin
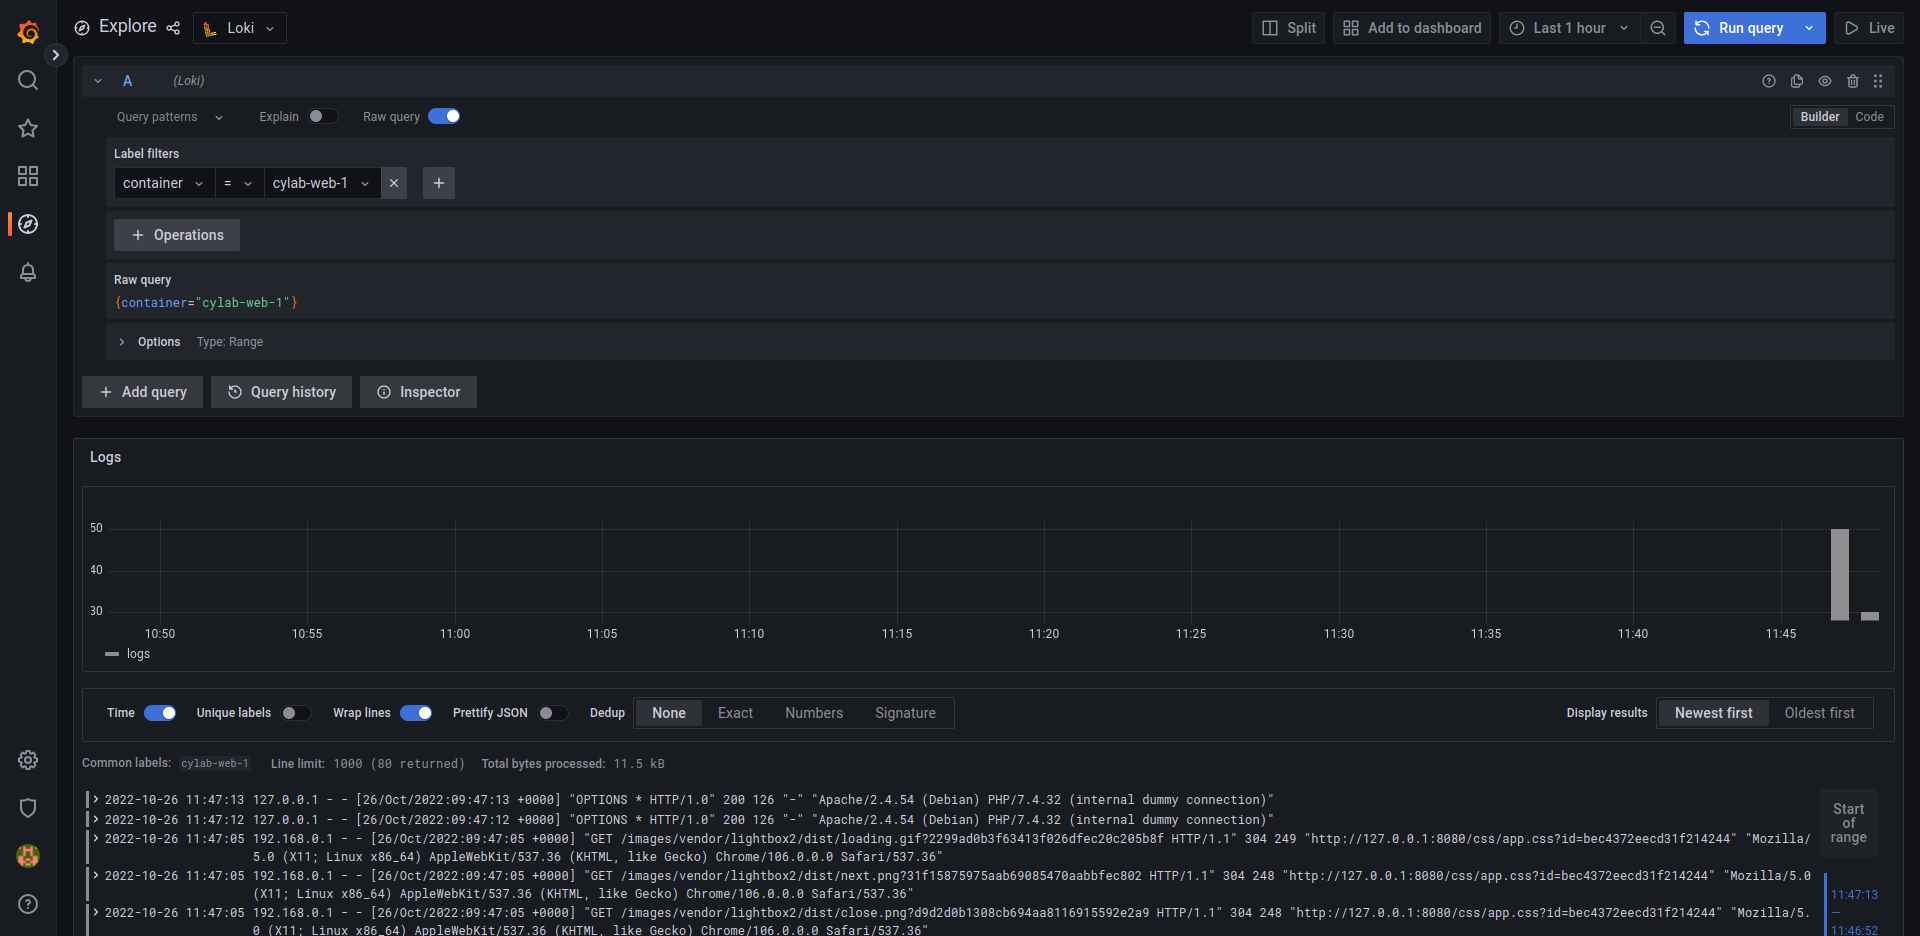
To check that data is flowing correctly:
- click on the ``Explore``` button on the left
- select one of your containers in
Label filtersbox - hit
ctrl+enteror click on theRun querybutton
Now you are ready to create your dashboards and alerts!
This blog post is licensed under
CC BY-SA 4.0


