Network traffic analysis with Python, Scapy (and some Machine Learning)
Dec 19, 2022 by Thibault Debatty | 26888 views
https://cylab.be/blog/245/network-traffic-analysis-with-python-scapy-and-some-machine-learning
Scapy is a wonderful Python library that allows to craft packets and send them on a network. In this blog post we show how Scapy can be used to read a pcap file, in order to detect abnormal behavior.
Installation
You can install Scapy using PIP:
pip3 install scapy
Read a PCAP
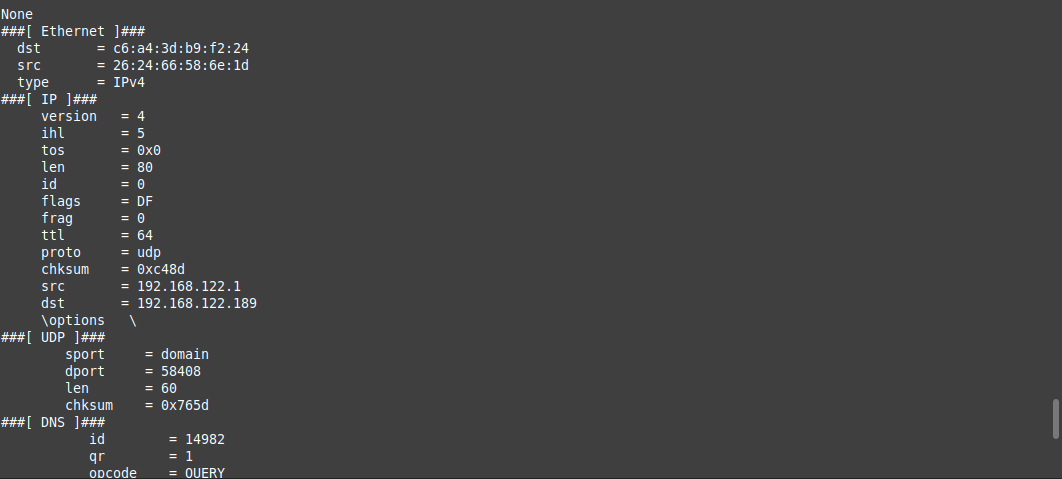
The first thing you want to do is open a pcap and loop over the packets. You can do this with PcapReader, which actually create a generator. Moreover, you can use the method packet.show() to show the list of available protocol layers and values:
from scapy.all import *

# PcapReader creates a generator
# it does NOT load the complete file in memory
packets = PcapReader("capture.pcap")

for packet in packets:
    print(packet.show())
Filter by protocol
Next, we will typically filter packets depending on the payload protocol. Therefore we can use the method packet.hasLayer(protocol). For example, to process only DNS packets:
from scapy.all import *

# PcapReader creates a generator
# it does NOT load the complete file in memory
packets = PcapReader("capture.pcap")

for packet in packets:
    if packet.hasLayer(DNS)
Detection of domain generation algorithms (DGA)
Domain generation algorithms (DGA) are algorithms seen in various families of malware that are used to periodically generate a large number of domain names that can be used as rendezvous points with their command and control servers. The large number of potential rendezvous points makes it difficult for law enforcement to effectively shut down botnets, since infected computers will attempt to contact some of these domain names every day to receive updates or commands.
For example, an infected computer could create thousands of domain names such as: www.qmsldazerfj.com and would attempt to contact these with the purpose of receiving an update or commands.
The technique was popularized by the family of worms Conficker.a and .b which, at first generated 250 domain names per day. [1]
However, most of these generated domain names have no corresponding DNS entry. This means a computer infected with a DGA malware will usually receive a lot of DNS replies that contain no answer (also sometimes called NXDOMAIN errors). We can use Python and Scapy to try to detect these by counting the number of empty DNS responses received by each IP in the capture:
from scapy.all import *

packets = PcapReader("capture.pcap")

counts = {}
# QR = Query Response
# ANCOUNT = Answer Count
# https://datatracker.ietf.org/doc/html/rfc5395#section-2
for packet in packets:
    if packet.haslayer(DNS) and packet[DNS].qr == 1 and packet[DNS].ancount == 0:
        # DNS query returned no answer
        # extract the destination IP (device that sent the query)
        ip = packet[IP].dst
        counts[ip] = counts.get(ip, 0) + 1

threshold = 100

print("+ Create list of suspicious IP addresses ...")
suspicious = []
for ip, occurrences in counts.items():
    if occurrences < threshold:
        continue
    suspicious.append(ip)

print(suspicious)
This approach is very similar to the way alerts are created in a SIEM software like Elasticsearch or Splunk. It has a main limitation: how can we define the threshold in a sensible way?
In our example we simply set a fixed threshold:
threshold = 100
For some networks (and some captures), this may generate a lot of alerts, while for some other networks and captures it may generate no alert at all!
Empirical detection rule
Luckily, we can use some simple Machine Learning (AI ?) algorithm to compute a sensible threshold. Conceptually, we want to compare the behavior of a device against some reference. There are 2 kinds of references that we can use:
- We can compare this device with other devices that we find in the pcap (or in the same subnet), because we assume that they should all exhibit the same behavior.
- We can compare the current behavior of the device with the behavior of the same device, but at another time. For example, we can compare the DNS behavior of a device now and one week ago, to try to detect an infection that took place in between…
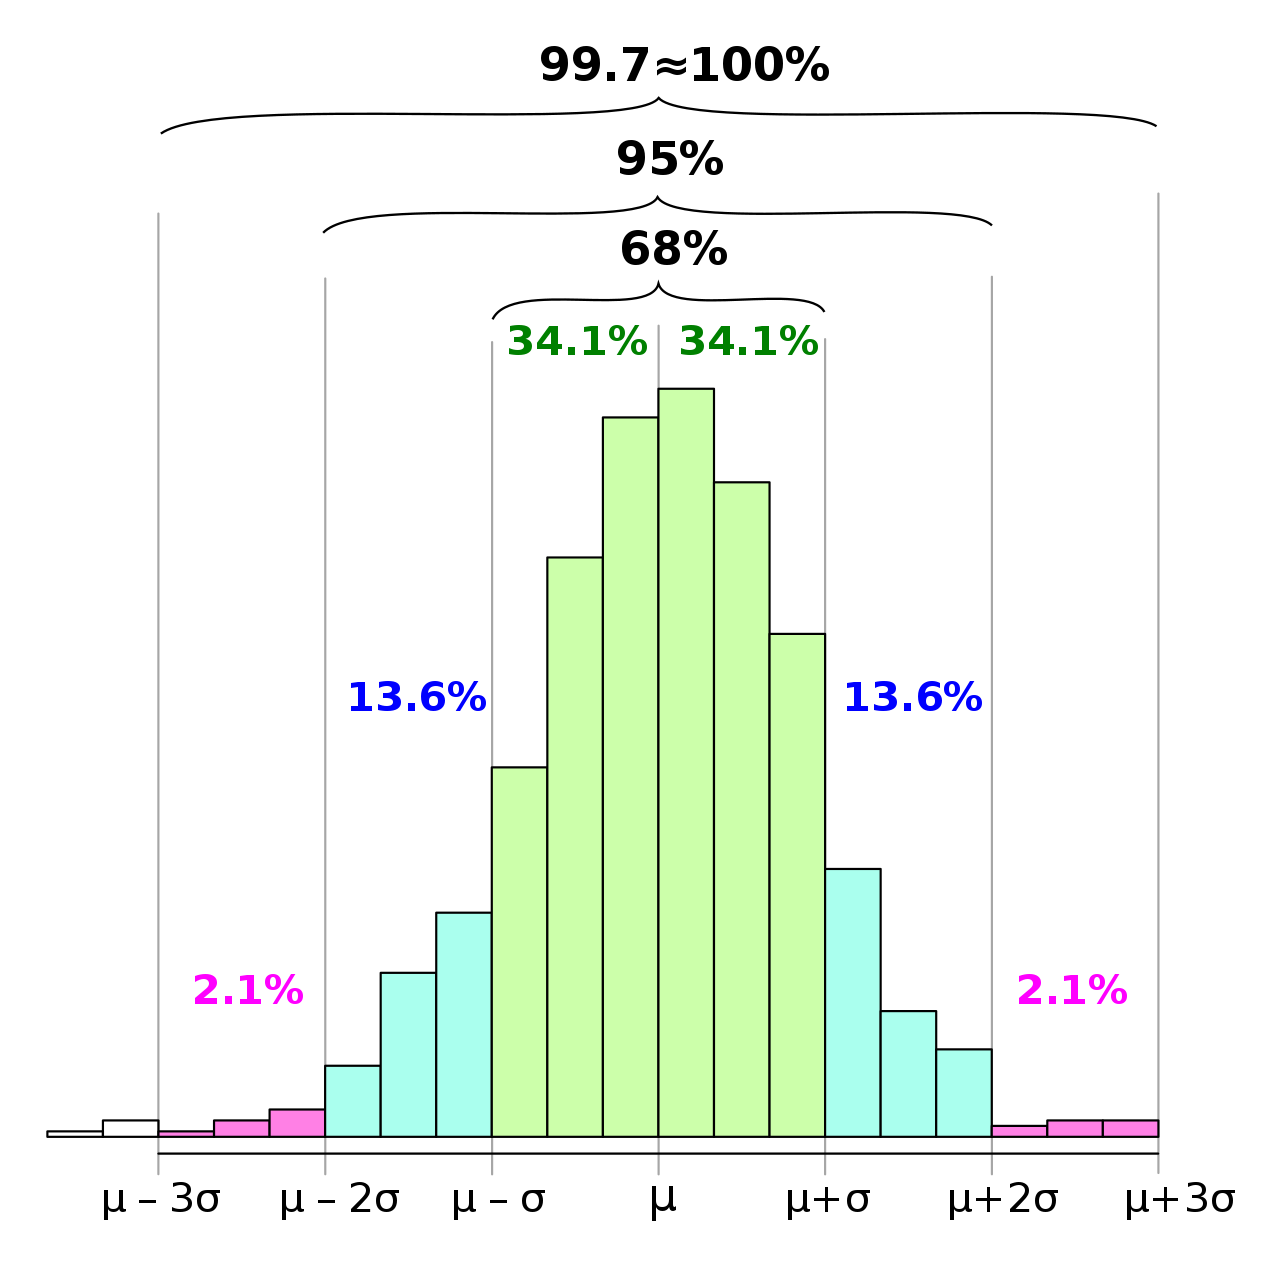
For the example below, we will use the first approach, and compare the DNS behavior of the different devices (IP addresses) present in the pcap. Moreover, to compute the threshold, we will use the empirical detection rule, also called the the three-sigma rule of thumb.
This rule is based on the fact that, in a normal dataset:
- the probability that a value is larger than μ + 3 σ is roughly 0.13% and
- the probability that a value is larger than μ + 2 σ is roughly 2.5%
where:
- μ is the mean of values and
- σ is the standard deviation.
This is illustrated on the histogram below: it shows that most devices (IP addresses) should cause the same number of NXDOMAIN replies, and only a few of them should cause a large number of NXDOMAIN replies.
So now we can use the Python statistics module to compute a sensible threshold, based on the mean number of NXDOMAIN replies cause by the devices:
import statistics

mean = statistics.mean(counts.values())
stddev = statistics.stdev(counts.values())
threshold = mean + 3 * stddev
Drawing a histogram
To help visualize the behavior of devices in the dataset, we can also use Python and the matplotlib library.
import math
import matplotlib.pyplot as plt

# a common trick to draw the histogram is to use
# the square root of the number of values as the number of bins:
bins = int(math.sqrt(len(counts)))
devices = len(counts)

plt.hist(counts.values(), bins=bins)
plt.title(f"Histogram of NXDOMAIN DNS responses per IP ({devices} devices, {bins} bins)")
plt.xlabel('Number of NXDOMAIN DNS responses')
plt.ylabel('Number of devices (IP addresses)')

plt.legend()
plt.show()
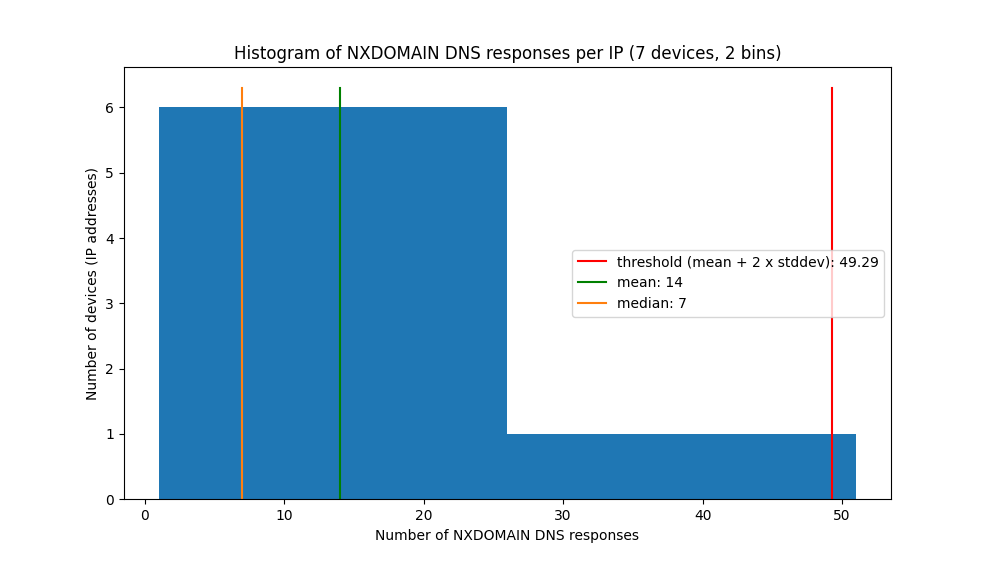
The result (tested on a very small capture) is shown below. It shows that most devices received around 7 NXDOMAIN replies (the median), and a few (actually one) devices received a lot of NXDOMAIN replies. Based on the mean and standard deviation, the threshold was computed as 49, which allowed to detect the infected device…
Going further
You can find additional examples on the repository https://gitlab.cylab.be/cylab/python-network-analysis
References
This blog post is licensed under
CC BY-SA 4.0


