Standalone Security Onion, a perfect SIEM solution for small networks
Apr 30, 2024 by Bart Van Hees | 12471 views
Sysadmin Network analysis and visualization Linux Monitoring SIEM
https://cylab.be/blog/338/standalone-security-onion-a-perfect-siem-solution-for-small-networks
Security Onion is a free and open platform built by defenders for defenders. It includes network visibility, host visibility, intrusion detection honeypots, log management, and case management.
Doug Burks started Security Onion as a free and open project in 2008 and then founded Security Onion Solutions, LLC in 2014.
Some of the information, pictures and quotes are based on the official Security Onion Manual
If you want to know more look at this video
Which SO deployment option is best for you?
If you want to deploy Security Onion (SO), you must make good considerations, both technically and security-wise, in order to achieve network visibility and a correct SO deployment. Be aware that SO does not have a build-in alert correlation tool, so you will receive only single event alerts.
The possible SO production deployment for real time network security are
- Standalone

- Distributed

Due to the technical part, the following aspects must be taken into account:
- The size of the network to be monitored
- Quantity of devices in the network to be monitored
- Hardware or virtual SO deployment
- Network Tabbing places
- Network Tabbing methods
Due to the security part, the following aspects must be taken into account
- Retention time
- Detection rules
- Detection methods
To give an example of how one decides which SO configuration to deploy, we will use the following network as an example:
- 15 virtual servers
- 15 physical servers
- 2 firewalls
- 2 switches
- /16 network mask and 1Gb speed
- Internet connected
- There are multiple different applications internet connected
You can say this is a small network even if it has a /16 mask.
With the overall speed limited to 1 GB we could set up 10 GB mirror ports in the firewalls and switches, if you are able to receive 10GB speeds on your hardware that hosts SO.
With the small amount of device logs (34 different devices) we will receive, we can decide to deploy a standalone SO
In a standalone deployment, the manager components and the sensor components all run on a single box, therefore, your hardware requirements will reflect that. You’ll need at minimum 48GB RAM, 16 CPU cores, 200GB OS and 2TB storage.
To determine your hardware requirements you best check the SO Documentation, but take this in to account:
- CPU: Used to parse incoming events, index incoming events, and search metadata. As consumption of data and events increases, more CPU will be required. If you have a 1GB network you will need 5 zeek workers, 5 suricata workers and min 6 workers for other services.
- RAM: Used for Logstash, Elasticsearch, and disk cache for Lucene. The amount of available RAM will directly impact search speeds and reliability. A network from 100Mbps to 1000Mbps needs between 16 and 128GB of RAM
- Disk: Used for storage of indexed metadata. A larger amount of storage allows for a longer retention period. It is typically recommended to retain no more than 30 days of hot.
How do you choose the detection method
For the network you have two options:
- Suricata Detection and Meta data
- Suricata Detection and Zeek meta data
Zeek meta data will give you a much more detailed insight into your network traffic than Suricata. The disadvantage of Zeek is that it requires a much larger amount of resources (CPU, Storage). So your choice here depends on the hardware resources.
Suricata detection rules are automatic updated and are always active.
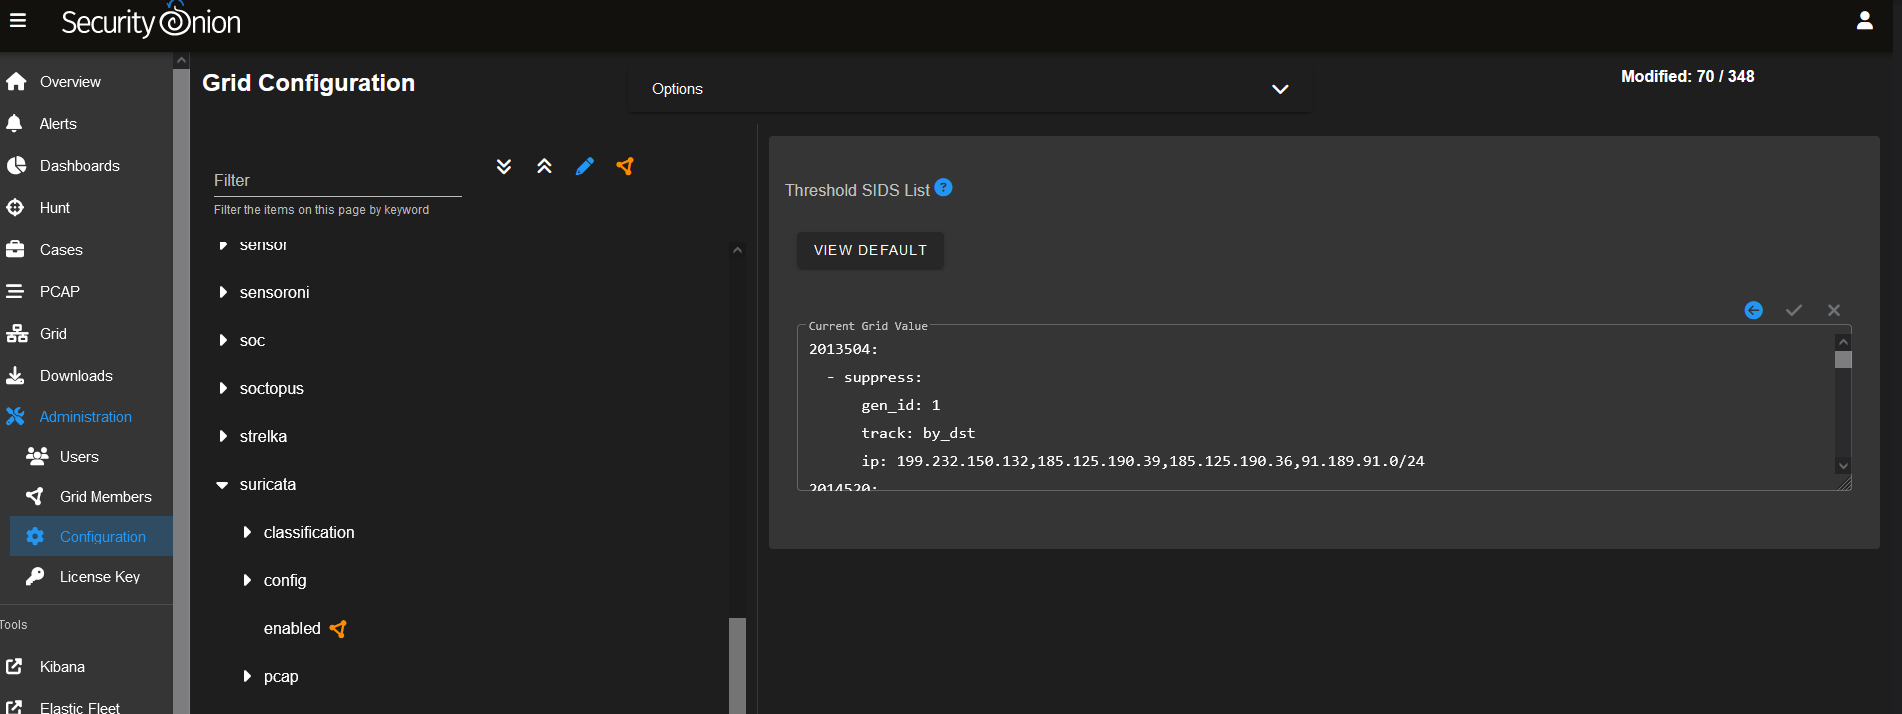
On default SO uses community sigma rules with elastalert and playbook, the standard rule module loaded are windows rules. But you can load also the following rule modules:
- Application
- Category
- Cloud
- Compliance
- Linux
- Macos
- Network
- Web
You choose your modules first on the used operating systems in your network than you add the modules that you think that you need. The sigma rules are by default not active.

For the device its depends on witch Integrations you deploy. SO has already a default agent created, but you will need to customize the integrations and agents to get the correct logs in SO.
You can also activate the elastic security module, this is not enabled by default and the alerts from this module will not appear in the SO dashboards. The rules are not active by default
Log collection
In general you will not collect logs for which you have no detection rules, to save disk space. If you have more than enough disk space you can collect all logs
Network Logs
SO standalone has a built-in network sensor, depending on the activation you will have metadate from Suricata or Zeek
Sensors that have full packet capture enabled need LOTS of storage. For example, suppose you are monitoring a link that averages 50Mbps, here are some quick calculations: 50Mb/s = 6.25 MB/s = 375 MB/minute = 22,500 MB/hour = 540,000 MB/day. So you’re going to need about 540GB for one day’s worth of pcaps.
These logs will constitute the largest amount in data volume in your elastic search.
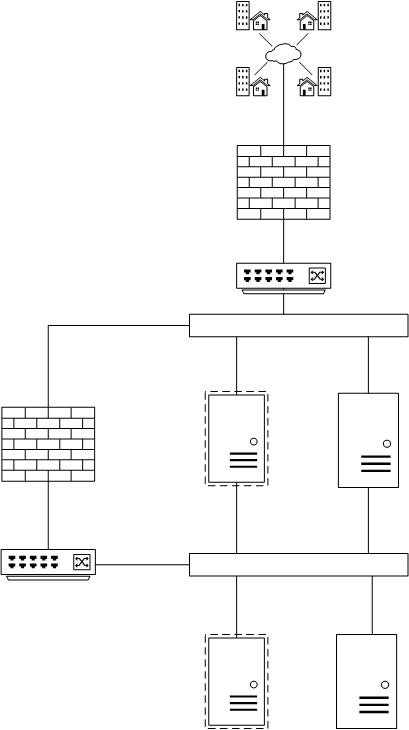
If you have a internet connected network, the best way is to place tabs on the external and internal site of your network. you have the choice for:
- Mirror port: you could have data loss because the lack of performance and/or throughput of the switch or router
- Dedicated tab devices: expensive
For our fictive netwok it will look like this because we opted for mirror ports

Device and application logs
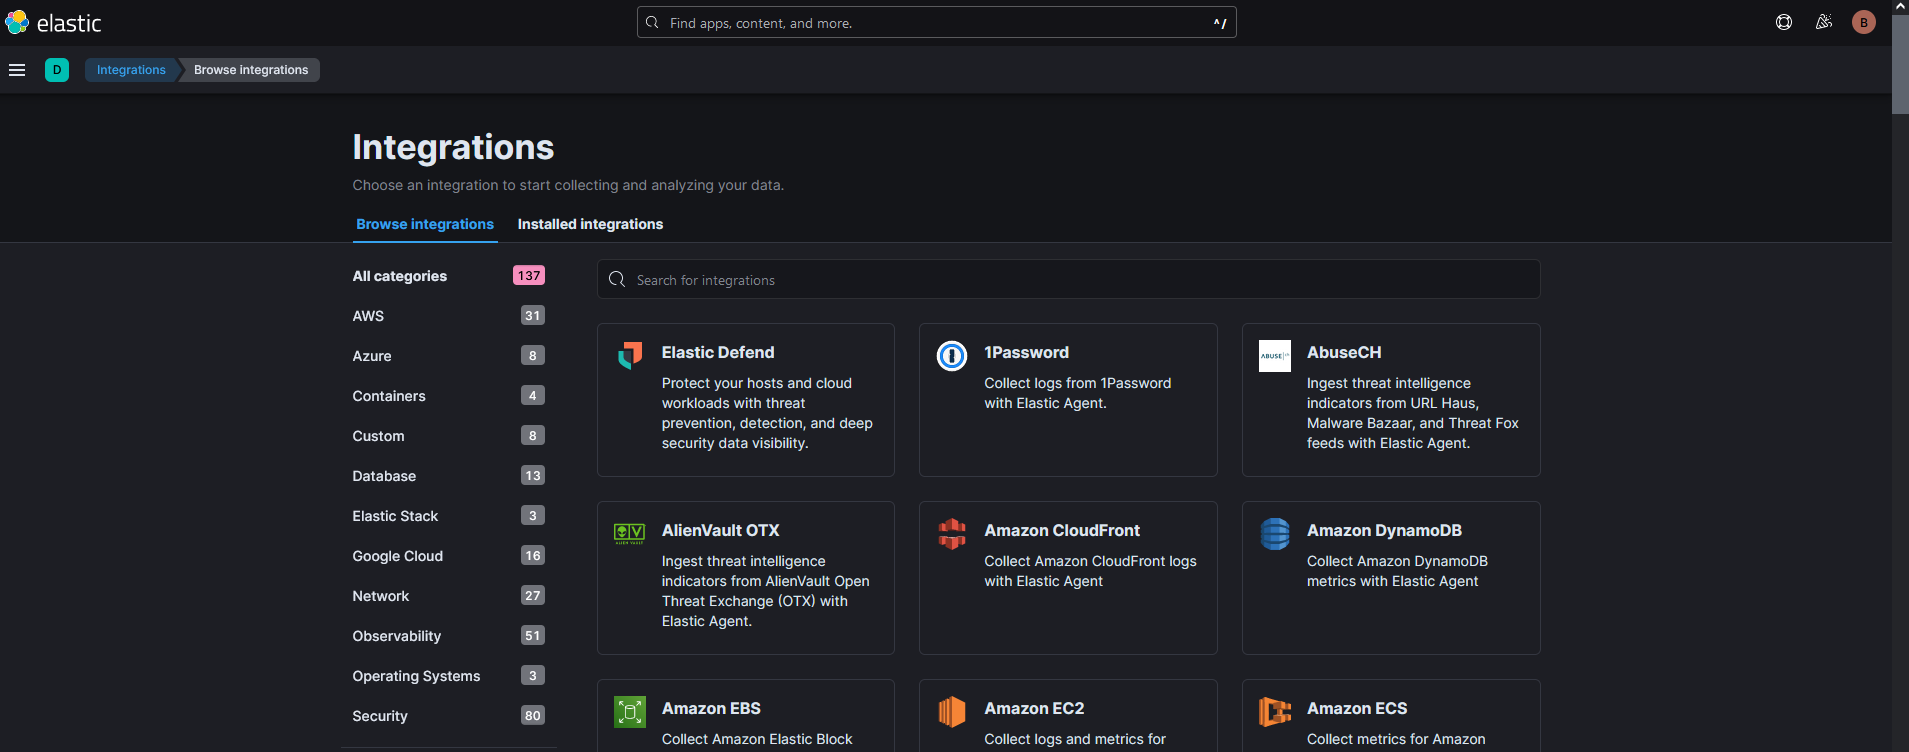
This is done with the elastic agent or syslog. With Elastic Agent you can collect all forms of data from anywhere with a single unified agent per host. One thing to install, configure, and scale.

Elastic Fleet
Fleet provides a web-based UI in Kibana for centrally managing Elastic Agents and their policies.
You can see the state of all your Elastic Agents in Fleet. On the Agents page, you can see which agents are healthy or unhealthy, and the last time they checked in. You can also see the version of the Elastic Agent binary and policy.
Fleet serves as the communication channel back to the Elastic Agents. Agents check in for the latest updates on a regular basis. You can have any number of agents enrolled into each agent policy, which allows you to scale up to thousands of hosts.
When you make a change to an agent policy, all the agents receive the update during their next check-in. You no longer have to distribute policy updates yourself.
When you’re ready to upgrade your Elastic Agent binaries or integrations, you can initiate upgrades in Fleet, and the Elastic Agents running on your hosts will upgrade automatically.

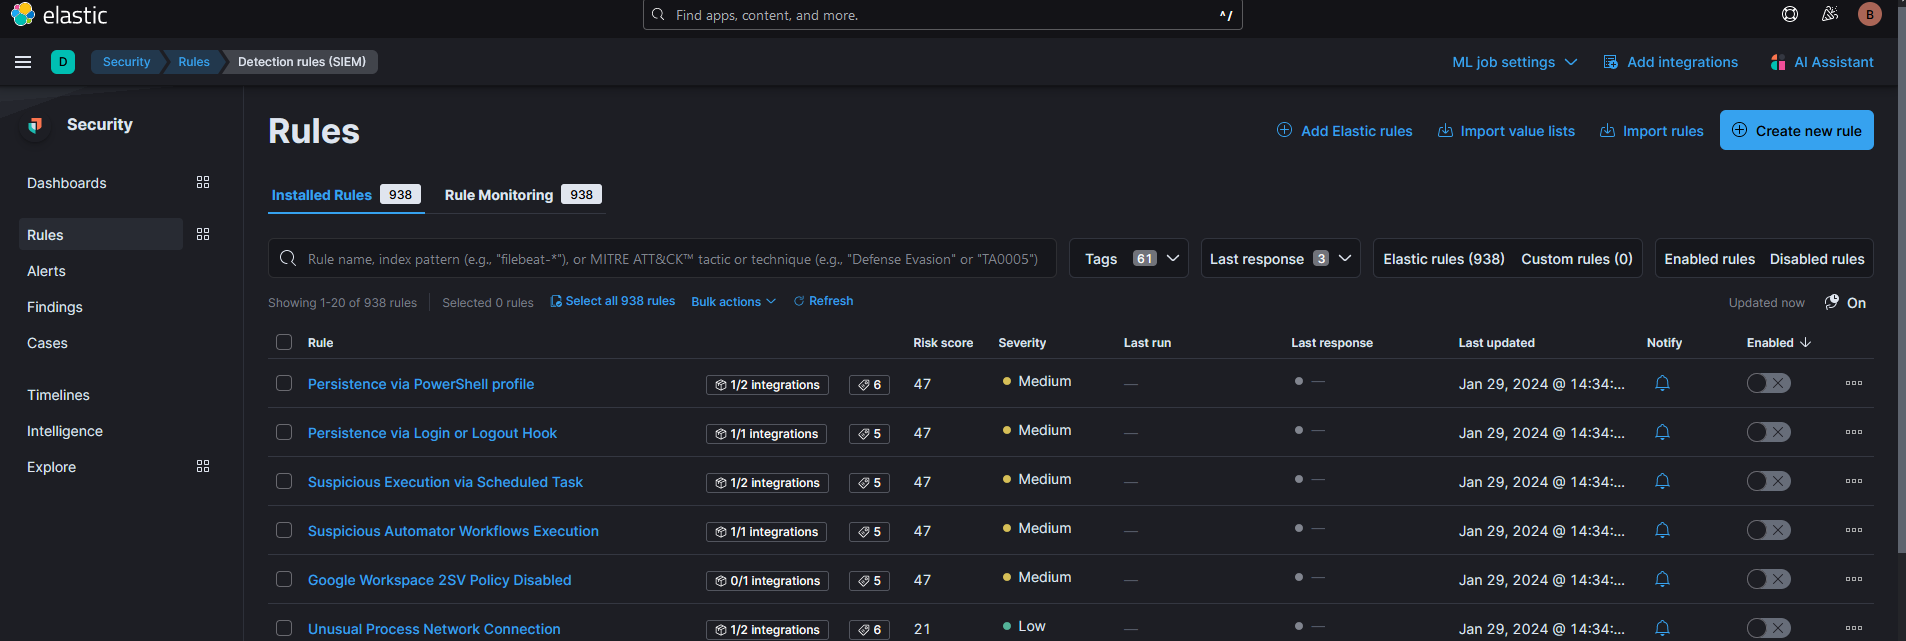
How do you implement rules and how to tweak them
The best way to implement rules, is to activate them one by one so you don’t get overwhelmed with alerts.
Since the suricata rules are already active, it is best to tweak them first before activating sigma or elastic rules.
In general you need to ask yourself this “Do I really want to detect this?” and this depends on:
- Is this a danger to my network: rules that create a large alert volume could be shut off to cancel noise
- In witch state is this rule: test, stable, experimental, deprecated, unsupported
- Do we use this applications: a rule for a application that is not in your network can create false positives.
- What is the false positive rate.
Security Onion Health check
The influxDB dashboard is the general health overview of your SO system.

SO Alert, Hunt and Cases Dashboards
Alert dashboard
This is the dashboard where all the playbook and suricata alerts will appear, you can auto refresh this dashboard. The following actions you can do whit an alert:Osquery is an open source tool that lets you query operating systems like a database, providing you with visibility into your infrastructure and operating systems. Using basic SQL commands, you can ask questions about devices, such as servers, Docker containers, and computers running Linux, macOS, or Windows. The extensive schema helps with a variety of use cases, including vulnerability detection, compliance monitoring, incident investigations, and more.
- Acknowledged: the alert is marked as seen
- Escalate: you create for the alert an case or add the alert to an case
- Drilldown: go to the details of the alerts

If you open the alert you can see the details of the log that created the alert, you can pivot to the hunt dashboard
Hunt Dashboards
SO has predefined hunt dashboards, but you can also use a alert to create a hunt dashboard.

Cases
If you escalate an alert to a case, you will be able to handle it here

##Elastic Search Kibana
All logs sent to SO will be parsed and ingested into elastic. You can perform a complete investigation of an anomaly via Kibana.

##OSQuery Manager With this integration, you can centrally manage Osquery deployments to Elastic Agents in your Fleet and query host data through distributed SQL.
This integration adds an Osquery UI in Kibana where you can:
- Run live queries for one or more agents
- View a history of past queries and their results
- Schedule queries to capture OS state changes over time
- Save queries and build a library of queries for specific use cases
Osquery results are stored in Elasticsearch, so that you can use the power of the stack to search, analyze, and visualize Osquery data.
Osquery is an open source tool that lets you query operating systems like a database, providing you with visibility into your infrastructure and operating systems. Using basic SQL commands, you can ask questions about devices, such as servers, Docker containers, and computers running Linux, macOS, or Windows. The extensive schema helps with a variety of use cases, including vulnerability detection, compliance monitoring, incident investigations, and more.

##Take Away SO is a budget-friendly SIEM solution that can be deployed quickly. If you have any doubts about whether your networks are still safe, with a good analysis you can remove the uncertainties of it.
This blog post is licensed under
CC BY-SA 4.0


