The ELK Stack and how to use it
Apr 16, 2021 by Georgi Nikolov | 6659 views
Managing big networks can be quite complicated- many inbound and outbound requests, network traffic, email correspondence and other activities that need to be monitored. It is quite easy for an attacker to obfuscate his actions, when we are confronted with large amounts of network data to analyze. Luckily there are ways to aggregate all this data and store it so it can be reviewed and hopefully discover any abnormal activity. Of course, I am talking about the use of a Security Information and Event Management (SIEM) framework. One such framework that has gained a lot of popularity, because of its modularity and open-source nature, is the ElasticSearch/Logstash/Kibana framework.
What is ELK Stack?

The ELK Stack is an acronym denoting a framework composed of three open-source projects: Elasticsearch, Logstash and Kibana. The ELK Stack facilitates the aggregation of logs from different systems and applications running in our network, parsing and enriching them with extra information, creating data specific visualizations, troubleshooting, security analytics and much more.
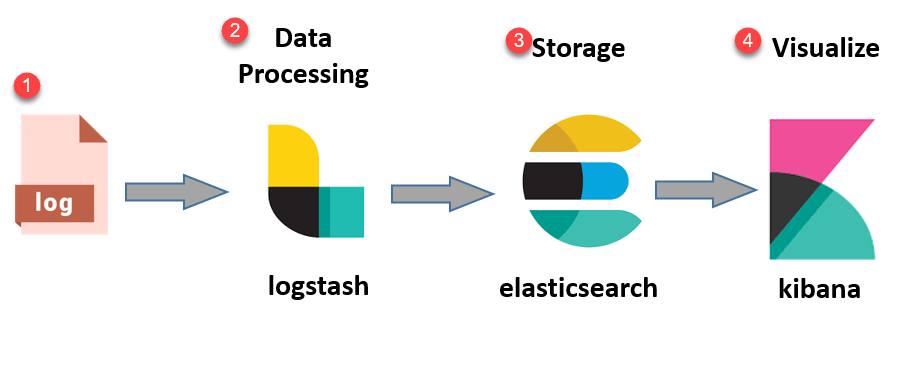
Network logs are gathered by Logstash, parsed following specific schemas and sent to ElasticSeach for storage. Storing the data can vary depending on origin/type of data/importance or other criteria. When needed, we can visualize the data using Kibana, through the use of the Kibana Dashboard, where we can define our own visualizations or use predefined ones.
Setting-up the ELK Stack
There are multiple ways to deploy the ELK Stack in our network- we can deploy each project individually, configuring it as we go, to suit our needs. This can be very finicky, but offers greater control over how the Stack will run. We can also use Docker containers to deploy the different parts of the Stack. Option two is easier to implement, as the configuration needed is minimal and we can directly start playing with the Stack and testing out its capabilities.
For this exercise, I opted for deploying the ELK Stack using Docker containers and more specifically, an implementation done by the community, found at the Github docker-elk project webpage. That is one of the great benefits of open-source projects- so many people can contribute and implement branches of the main project, which can be super useful in different circumstances.
Network schema
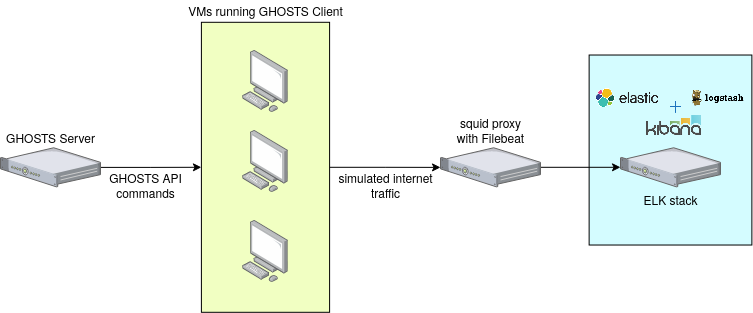
I have opted to deploy the ELK Stack on a Linux Virtual Machine inside our own Cyber Range. That way I can later connect Logstash to a proxy server and collect logs from there. The proxy server is configured to collect HTTP/HTTPS logs and store them in squid format, and using Filebeat, I can forward them to Logstash. The logs are generated using the GHOSTS framework.
Deploying the ELK containers
The Docker-ELK project has packaged and prepared carefully the different component of the ELK stack to make it easy for configuration and deployment. Through the use of the docker-compose file we can start it up in no time and have an ELK Stack running on our machine. The project has a very well written manual and explains in detail how to run the ELK Stack and configure it if need be, so I am not going to go through it here. I will do mention couple of important things:
- The Use of XPack License
By default, Elastic Search comes with the X-Pack extension that provides security, alerting, monitoring, reporting and tons of other features. If you want to use the extension’s features, the extension comes with a free 30-day trial. After the trial period is over, you will need to get a valid key for it, or switch to the “basic” use, where the majority of features are disabled.
X-Pack is an Elastic Stack extension that provides security, alerting, monitoring, reporting, machine learning, and many other capabilities. By default, when you install Elasticsearch, X-Pack is installed. If you want to try all of the X-Pack features, you can start a 30-day trial. More information about the License Management can be found on the official Elastic Search website.
If you want to turn off the paid features, it can be done through the Elastic Search config file, by adapting the xpack.license.self_generated.type line from trial to basic.
## Default Elasticsearch configuration from Elasticsearch base image.
## https://github.com/elastic/elasticsearch/blob/master/distribution/docker/src/docker/config/elasticsearch.yml
#
cluster.name: "docker-cluster"
network.host: 0.0.0.0

## X-Pack settings
## see https://www.elastic.co/guide/en/elasticsearch/reference/current/setup-xpack.html
#
xpack.license.self_generated.type: trial -> basic
xpack.security.enabled: true
xpack.monitoring.collection.enabled: true
Don’t forget that, if changes to the configuration files are made, the docker container running Elastic Search should be re-deployed.
- Injecting data
After setting up the ELK Stack, we would like to test it with some data.
We have multiple solutions to inject data through Logstash. The easiest is using netcat and passing the data to Logstash to be parsed and forwarded to Elastic Search. This can be done with the simple command:
$ cat /path/to/your/logfile.log | nc -q0 localhost 5000
This command will go through the logfile, line per line, and send each line via netcat to the service, running on your localhost, listening on port 5000 (in this case Logstash).
To facilitate that, i wrote a simple bash script that reads a file and sends the lines one by one via netcat to Logstash.
#!/usr/bin/env bash

if [ "$#" -ne 1 ]; then
  echo "Pass a txt file to be read line by line and sent to logstash"
  echo "Usage: $0 <path/to/txt_file>";
  exit 1;
fi

file=$1
echo "## Reading the txt file $file...";
while read line; do
  echo $line | nc -q0 localhost 5000
  sleep 10
done < $file
A better solution for this is to use a tool, such as Filebeat, to parse the log files and send them to Logstash.
- Using Kibana
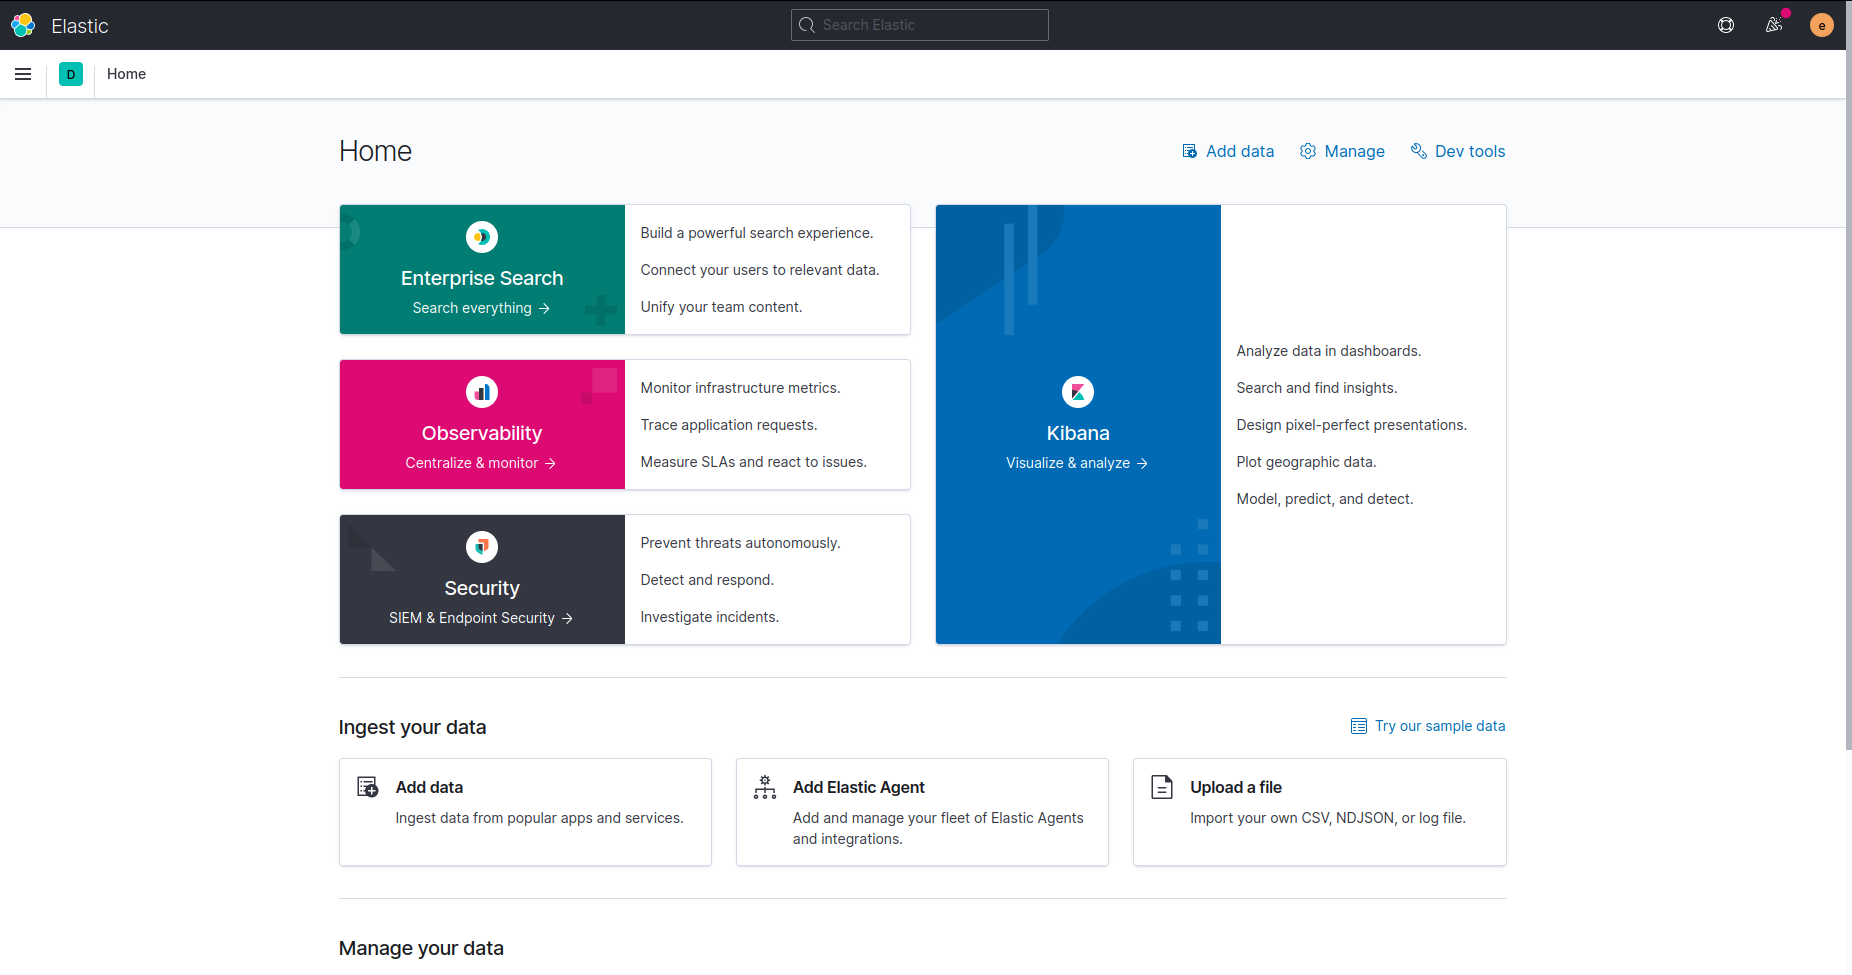
Finally, we can view our data using the Kibana dashboard. To access Kibana, we can use a web browser and visit localhost:5601. There, we are greeted by a log-in screen, where the previously generated ELK password needs to be filled in. When that is done, the Home Screen of Kibana is displayed.
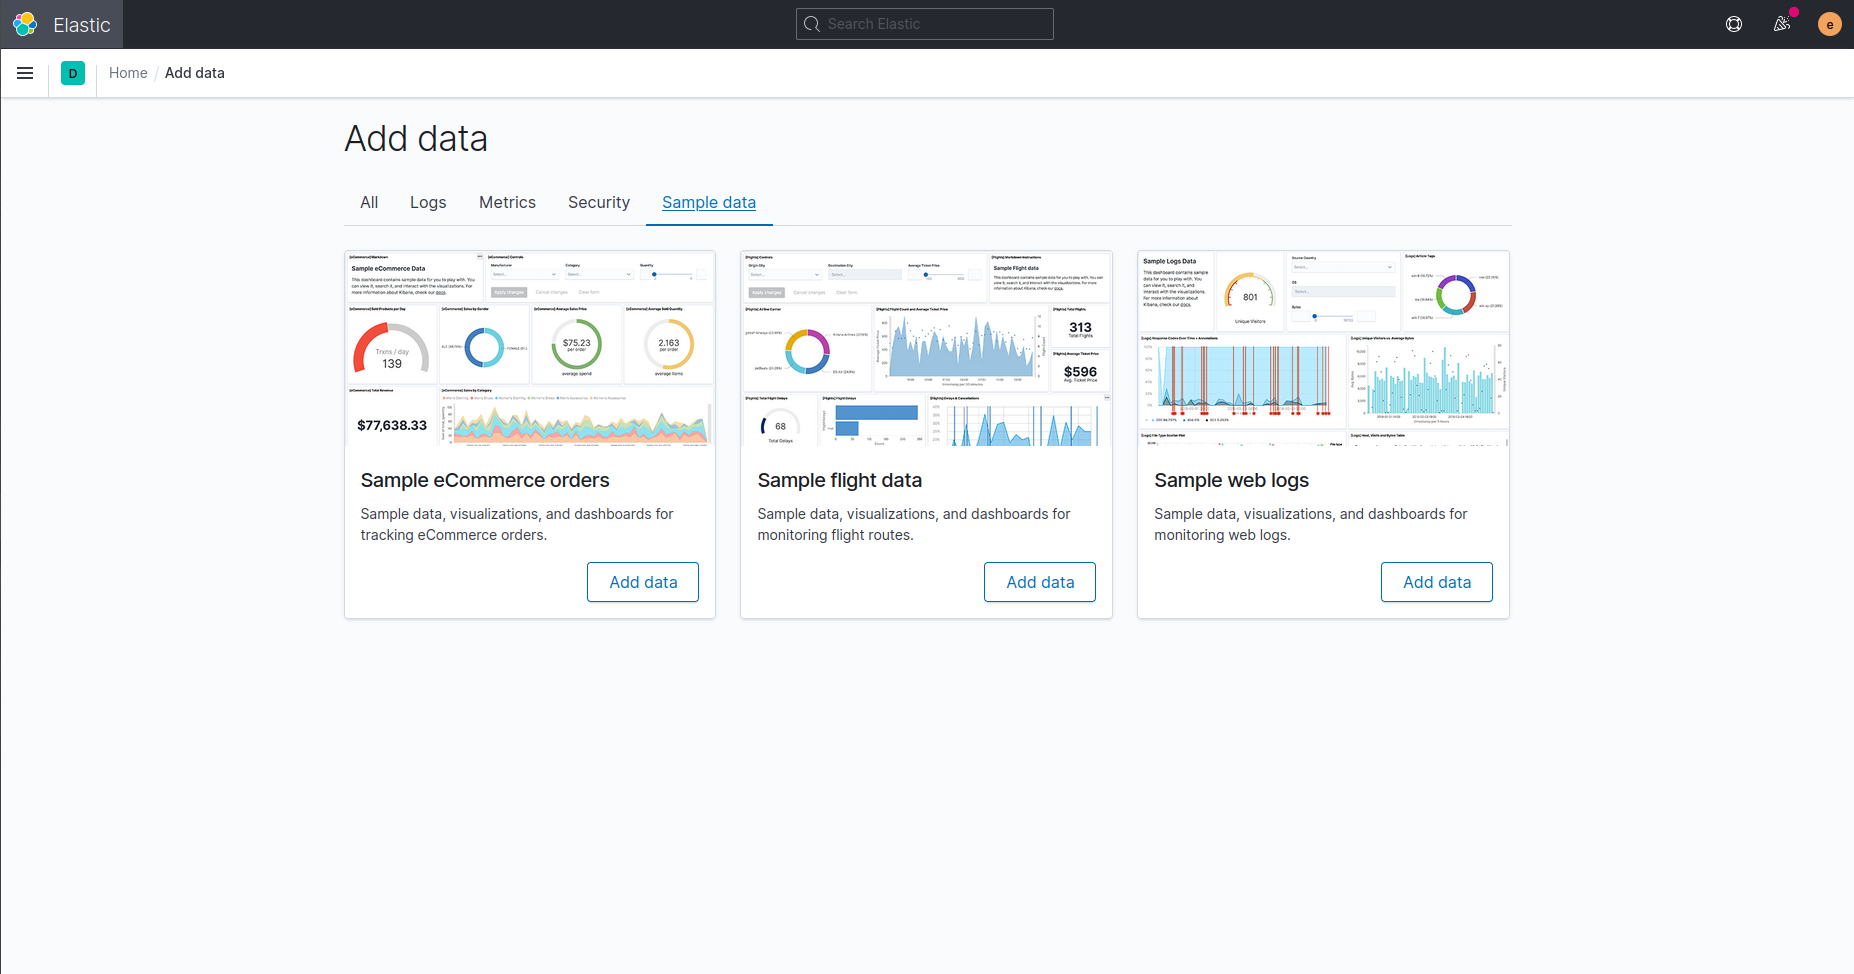
By using the Kibana menu on the top left, we can go to “Overview” to visualize the data. If no data is present, an option for adding sample data is available.
Conclusion
The ELK Stack technology is very powerful and its open-source nature offers great manageability, extensibility and support. It can be a bit complicated to set-up at first, but multiple branches of the initial project are available online, as the one used in this blog, to simplify the deployment and testing. The last step in our set-up is collecting the generated data and forwarding it to Logstash using Filebeat.
Installing and running the ELK Stack is only the first step, we have a powerful Security Information and Event Management tool at our disposal, it is now up to us to use it to its full capabilities going forward.
This blog post is licensed under
CC BY-SA 4.0


