Log management with Loki : getting started
Oct 1, 2021 by Thibault Debatty | 10606 views
https://cylab.be/blog/174/log-management-with-loki-getting-started
Loki is a log database developed by Grafana Labs. It’s similar to Elasticsearch, with some major conceptual differences:
- Loki has a very simple indexing system, that only indexes a few labels for every log line;
- Loki will compress the actual log lines before they are saved to disk.
This may seem quite simplistic, but the result is actually extremely effective: in a comparison based on 42GB of logs generated by Nginx, ELK consumed 107GB of disk space to store the data and index, while Loki consumed only 9GB!
https://crashlaker.medium.com/which-logging-solution-4b96ad3e8d21
- Moreover, Loki can index the logs generated by your Kubernetes cluster out-of-the-box.
Architecture
A typical Loki stack consists of:
- Loki itself, the log database (this would be the equivalent of Elasticsearch);
- Grafana, the visualisation web interface (equivalent of Kibana);
- Promtail, that allows to scrape log files and send the logs to Loki (equivalent of Logstash).
Next to promtail, some other tools can also be used to inject logs into Loki:
- Logstash (yes, the one from ELK);
- Fluentd and Fluent Bit, the log collectors and forwarders.
Installation with Docker
The easiest way to test Loki is using docker and docker-compose:
Download the docker-compose.yaml file:
wget https://raw.githubusercontent.com/grafana/loki/v2.3.0/production/docker-compose.yaml -O docker-compose.yaml
Or copy the following content to docker-compose.yaml:
version: "3"

networks:
  loki:

services:
  loki:
    image: grafana/loki:2.3.0
    ports:
      - "3100:3100"
    command: -config.file=/etc/loki/local-config.yaml
    networks:
      - loki

  promtail:
    image: grafana/promtail:2.3.0
    volumes:
      - /var/log:/var/log
    command: -config.file=/etc/promtail/config.yml
    networks:
      - loki

  grafana:
    image: grafana/grafana:latest
    ports:
      - "3000:3000"
    networks:
      - loki
As you can see, this docker-compose configuration uses /var/log as a volume, such that promtail can scrape and index the logs from your host system.
You can start the containers with:
docker-compose up
Configuration of Grafana
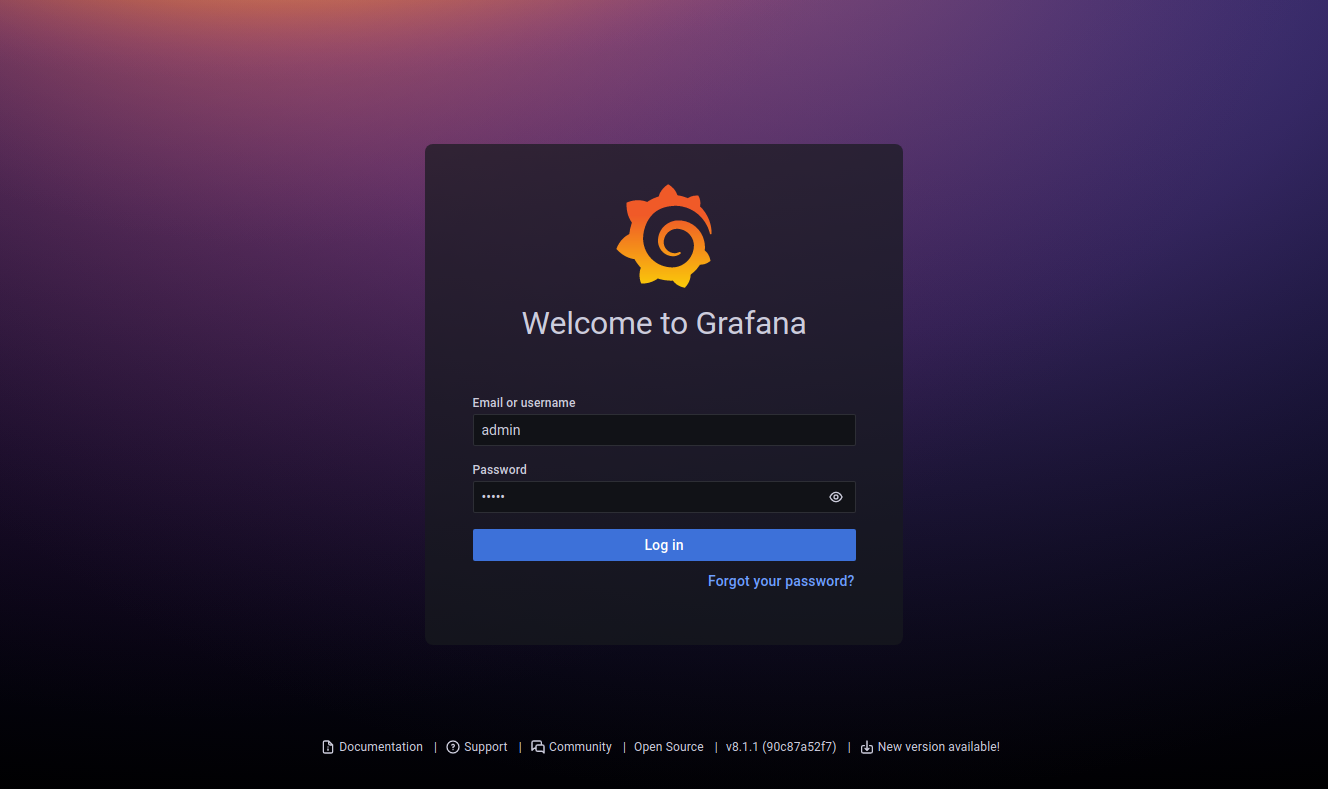
Once the containers are running, the Grafana web interface will be available at http://localhost:3000
The default credentials are:
- Username:
admin - Password:
admin
Grafana is initially not connected to the Loki server. To establish the connection:
- Select
Configuration > Data sourcesin the left menu
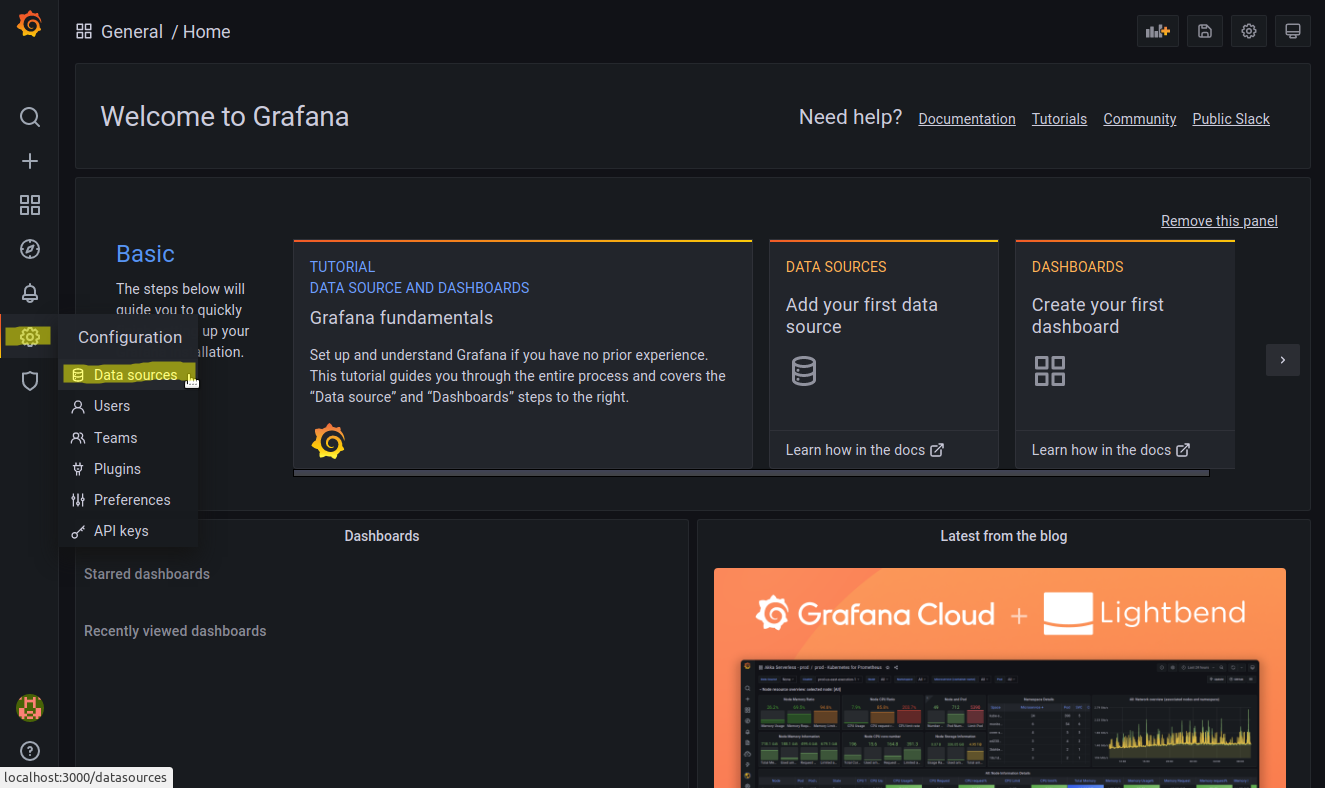
- Click on
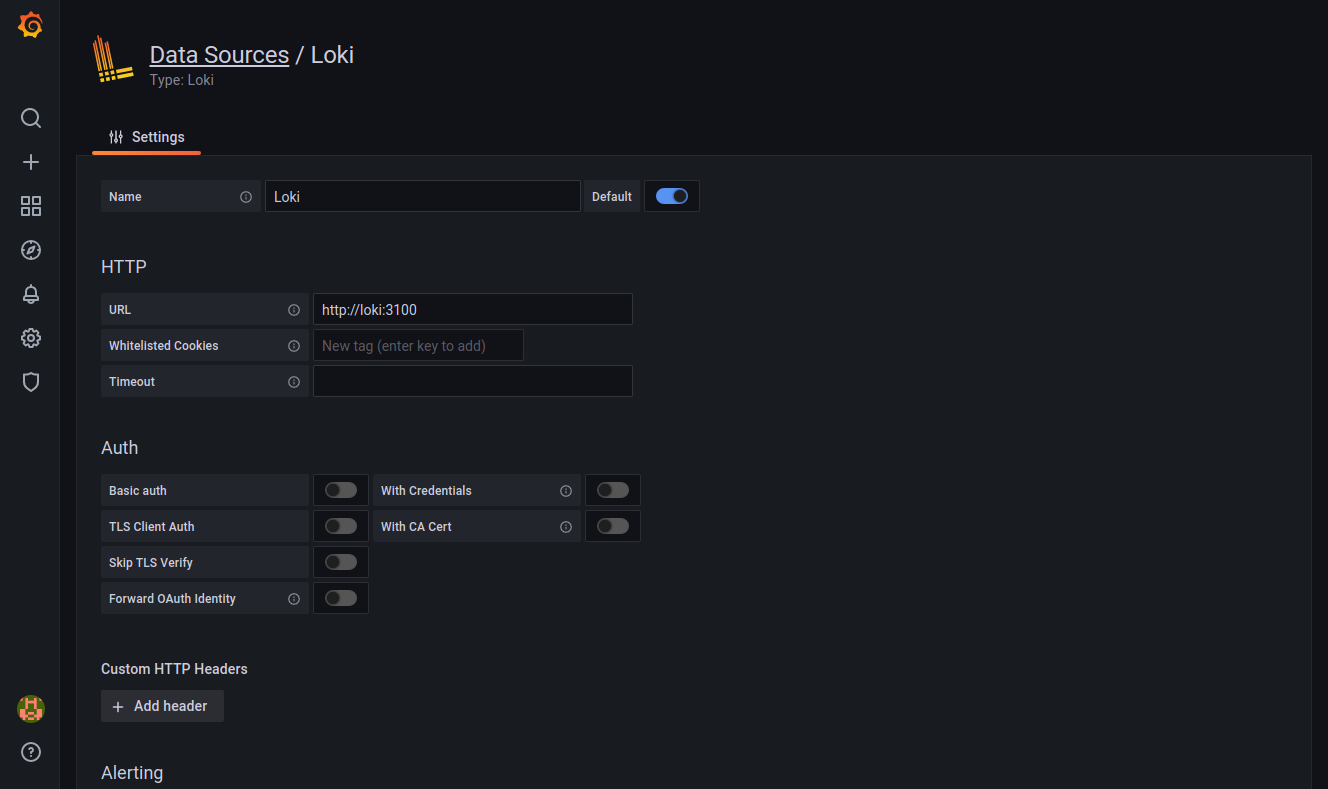
Add a data sourceand selectLokiin the list - Fill the
URLfield withhttp://loki:3100, then click onSave & testat the bottom
First steps
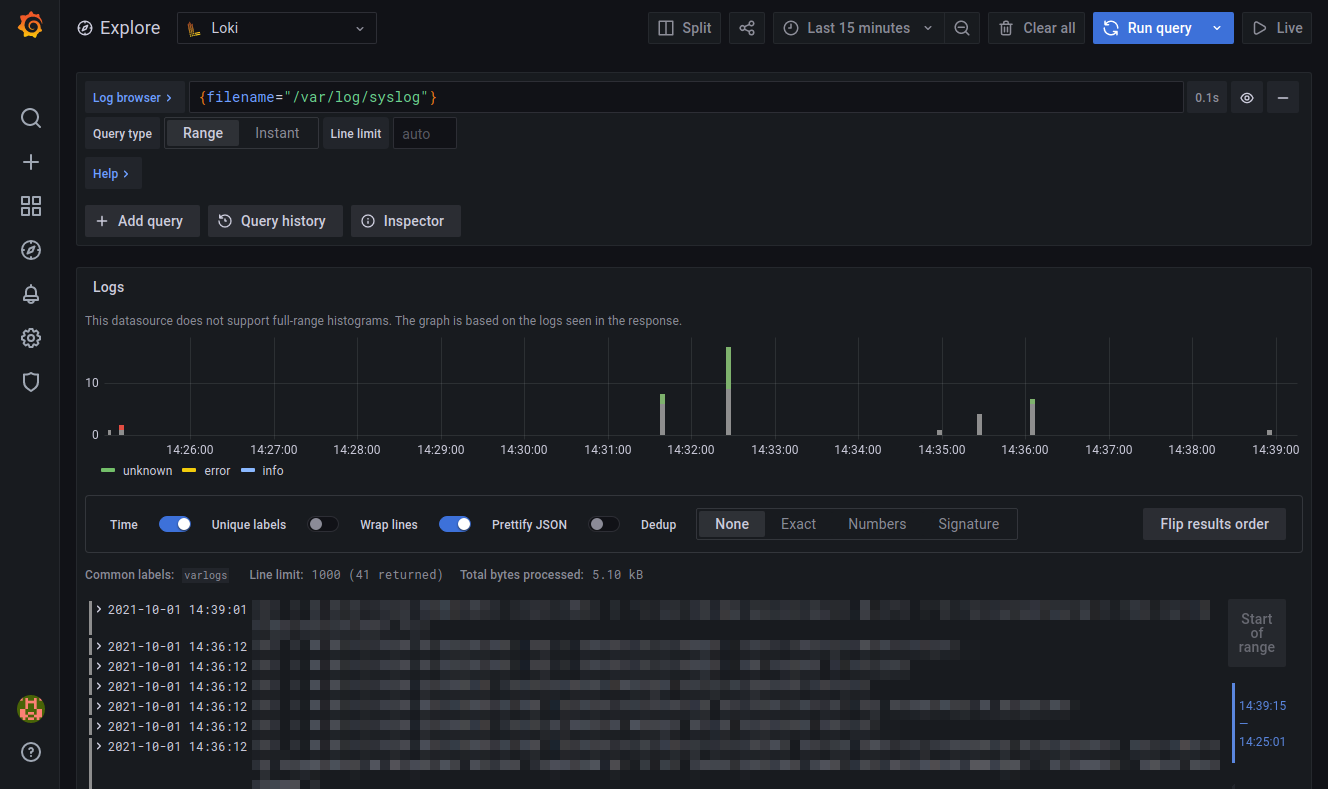
To discover Loki and Grafana, and to inspect your logs, you can click on the Explore button on the left (the compass).
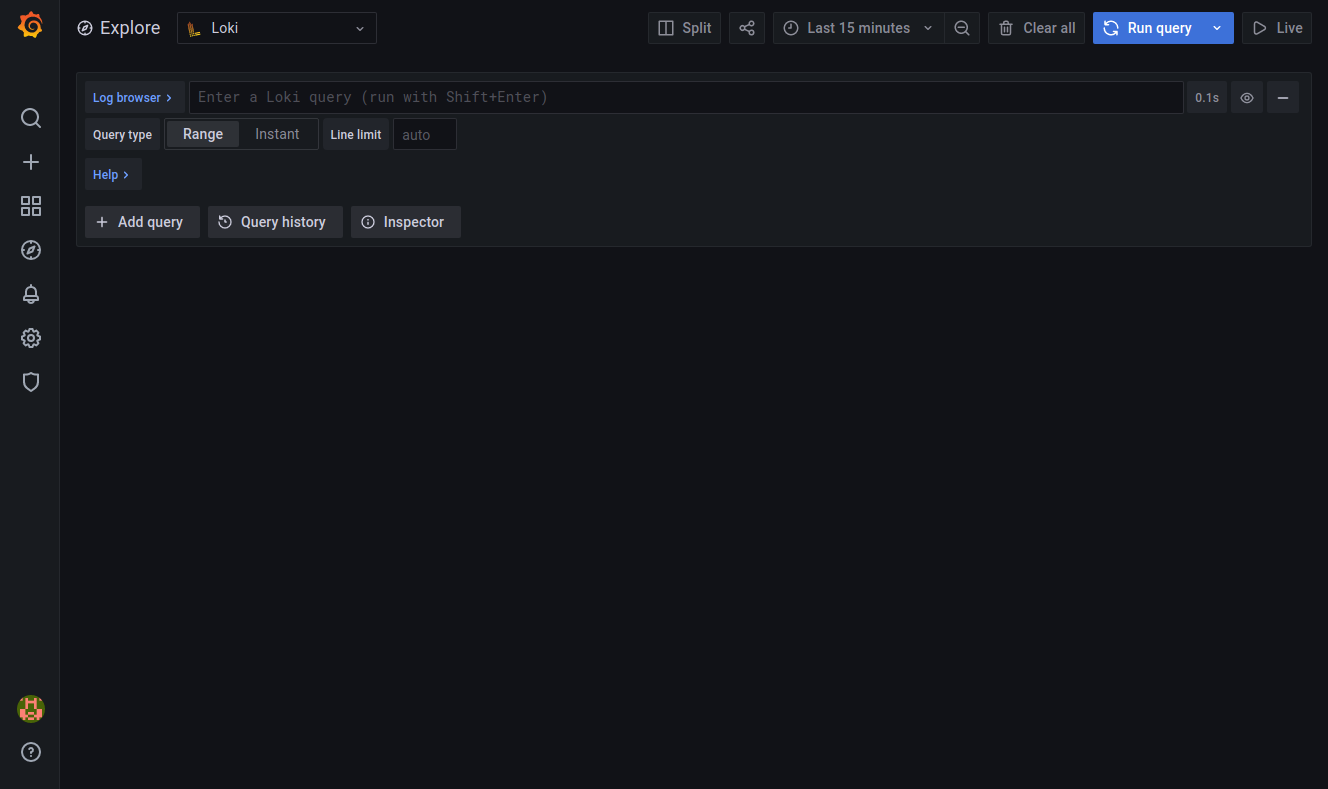
The main field at the top allows to type a LogQL query. You can try with the following query, that will show you the logs from /var/log/syslog:
{filename="/var/log/syslog"}
- this field has an autocomplete feature, so it is actually pretty simple to type your queries;
- you can execute your query by hitting
shift + enter; - you can find the details of LogQL at https://grafana.com/docs/loki/latest/logql/
You can also use the following query to count the number of log entries received per second, using an aggregation window of 5 minutes:
rate({filename="/var/log/syslog"}[5m])
Final words
Now you can use Loki and Grafana to monitor Kubernetes containers
Loki and Grafana also have other features like dashboards and alerting. These will be covered in coming blog posts…
This blog post is licensed under
CC BY-SA 4.0


