Deploy Loki on Kubernetes, and monitor the logs of your pods
Jan 20, 2022 by Thibault Debatty | 31849 views
https://cylab.be/blog/197/deploy-loki-on-kubernetes-and-monitor-the-logs-of-your-pods
Loki is a log database developed by Grafana Labs. In a previous blog post we have shown how to run Loki with docker-compose. In this blog post we will deploy Loki on a Kubernetes cluster, and we will use it to monitor the log of our pods.
Installation
The easiest way to deploy Loki is using Helm. So first make sure you installed Helm.
Then you can add the helm repository of Grafana:
helm repo add grafana https://grafana.github.io/helm-charts
A typical Loki stack consists of:
- Loki itself, the log database (this would be the equivalent of Elasticsearch);
- Grafana, the visualisation web interface (equivalent of Kibana);
- Promtail, that allows to scrape log files and send the logs to Loki (equivalent of Logstash).
You can install the complete stack in a dedicated namespace (loki) with:
helm install loki grafana/loki-stack--namespace loki --create-namespace --set grafana.enabled=true
When Grafana is deployed, a random password is generated, so now you should extract the password of Grafana:
kubectl get secret --namespace loki loki-grafana -o jsonpath="{.data.admin-password}" | base64 --decode ; echo
Furthermore, the grafana interface is not exposed to the outside world, so you must use kubectl port-forward to create a tunnel from your computer to the loki-grafana service:
kubectl port-forward --namespace loki service/loki-grafana 3000:80
Grafana will now be available at http://localhost:3000 using following credentials:
- Username:
admin - Password: the password you extracted at the previous step…
First steps
The default installation settings of the loki stack are pretty complete:
- the data source is correctly configured in Grafana
- promtail is configured to scrape the logs of the pods running on your cluster
This means you can directly head to the Explore menu to check the logs of your pods:
- click on the compass on the left;
- at the top of the screen, select the
loki; - the main field at the top allows to type a LogQL query.
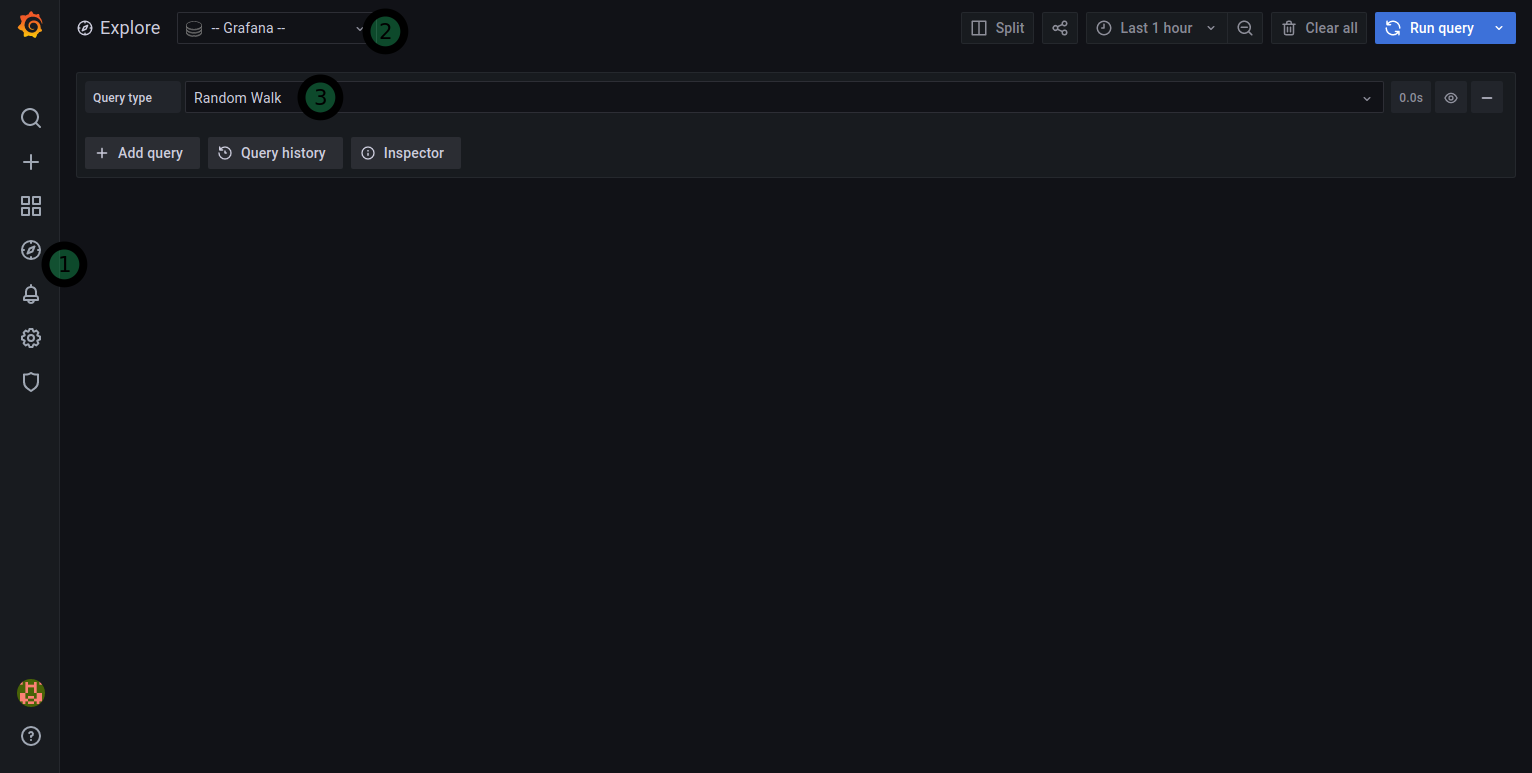
You can try with the following query, that will show you the logs from the pods of the loki namespace:
{namespace="loki"}
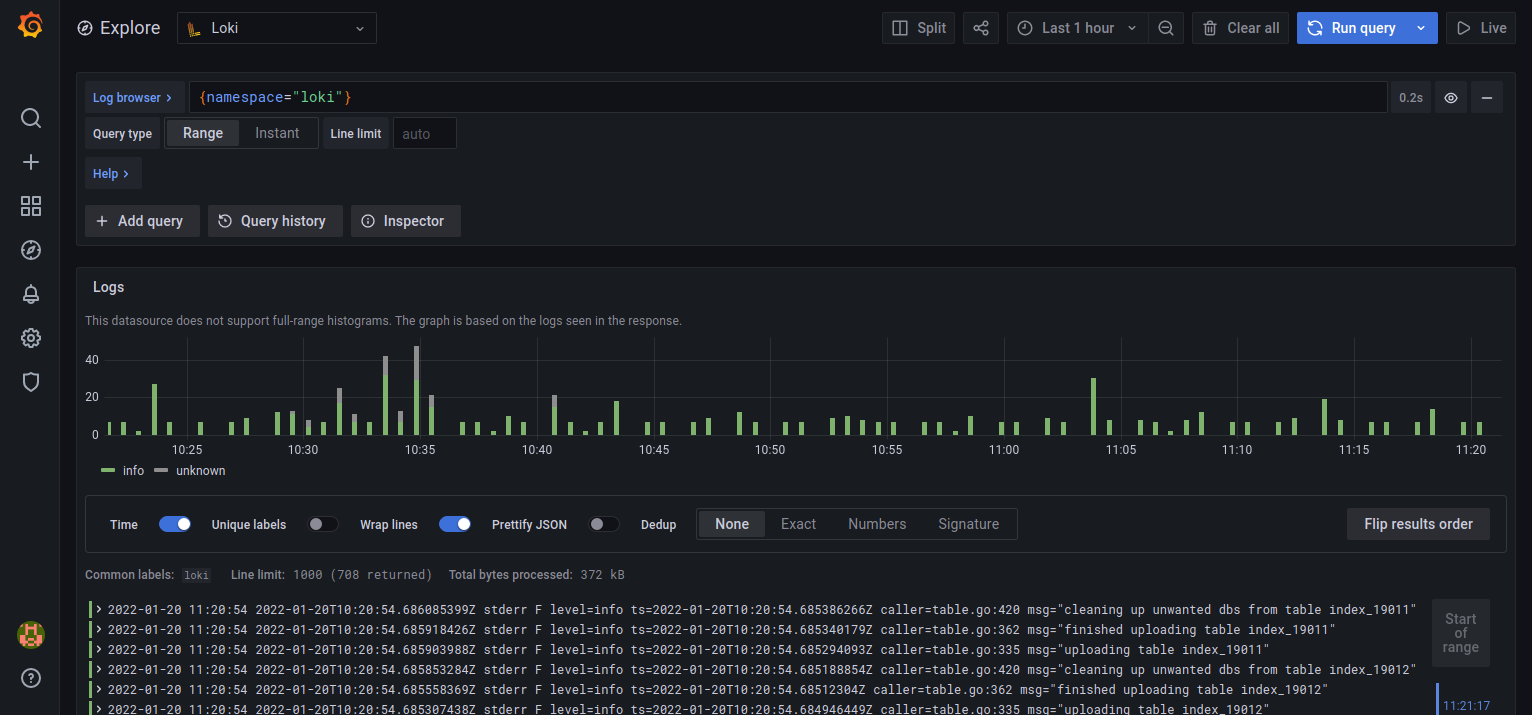
This field has an autocomplete feature, so it is actually pretty simple to type your queries. You can find the details of LogQL at https://grafana.com/docs/loki/latest/logql/
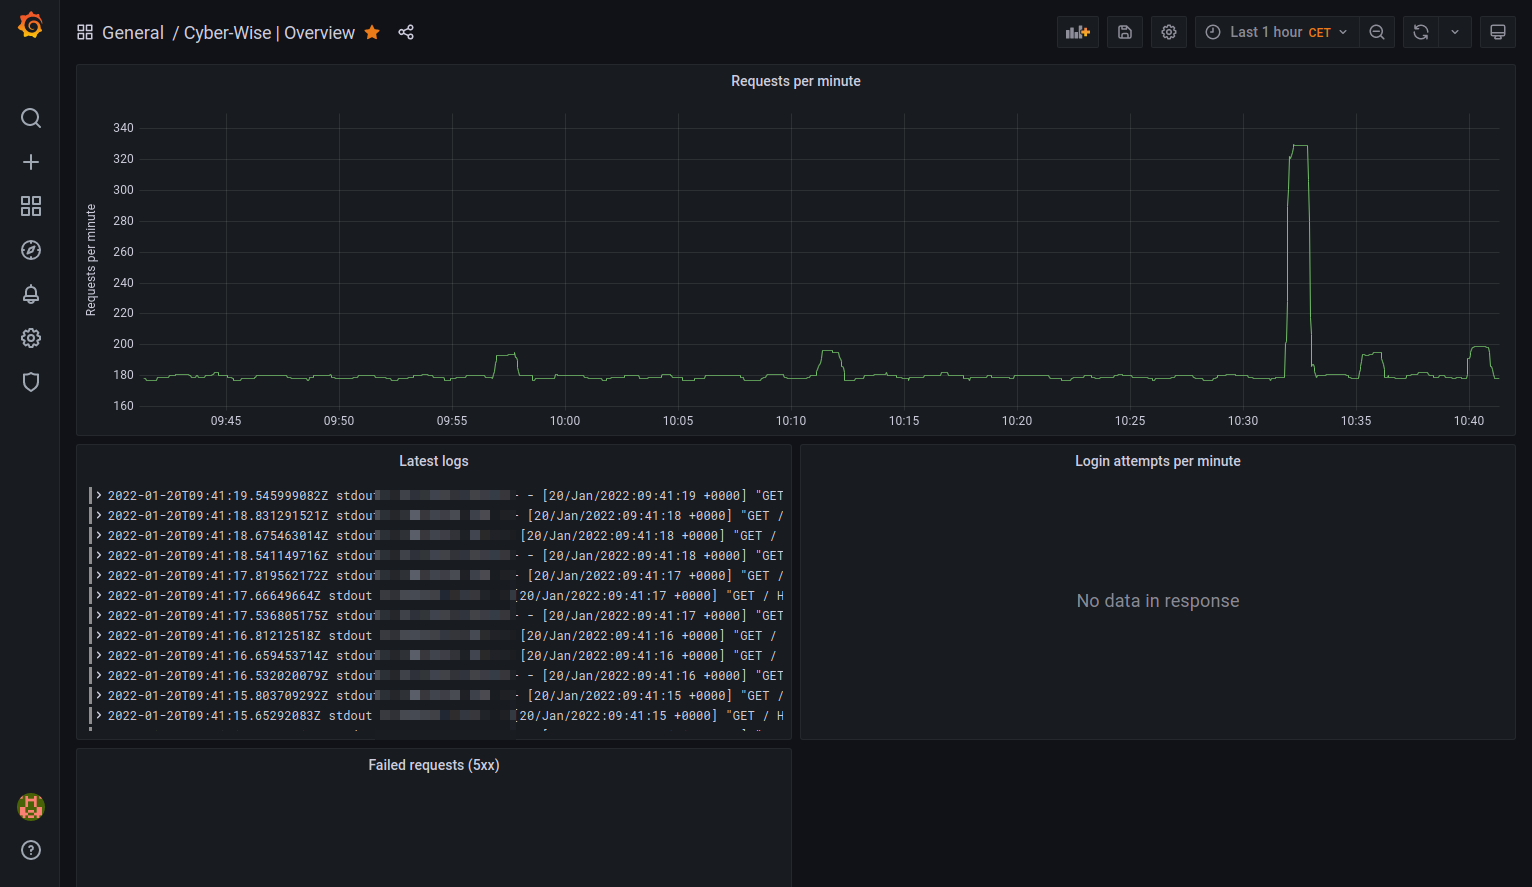
Apache dashboard
Grafana also allows to create dashboards, to quickly visualize and monitor the state of your application. To create a new dashboard, click on the + on the left.
Then you can add multiple panels to your dashboard. For each panel, you should at least fill:
- the type of data (time series, gauge, logs etc.);
- the data source (is always
Lokifor our examples); - the query to execute.
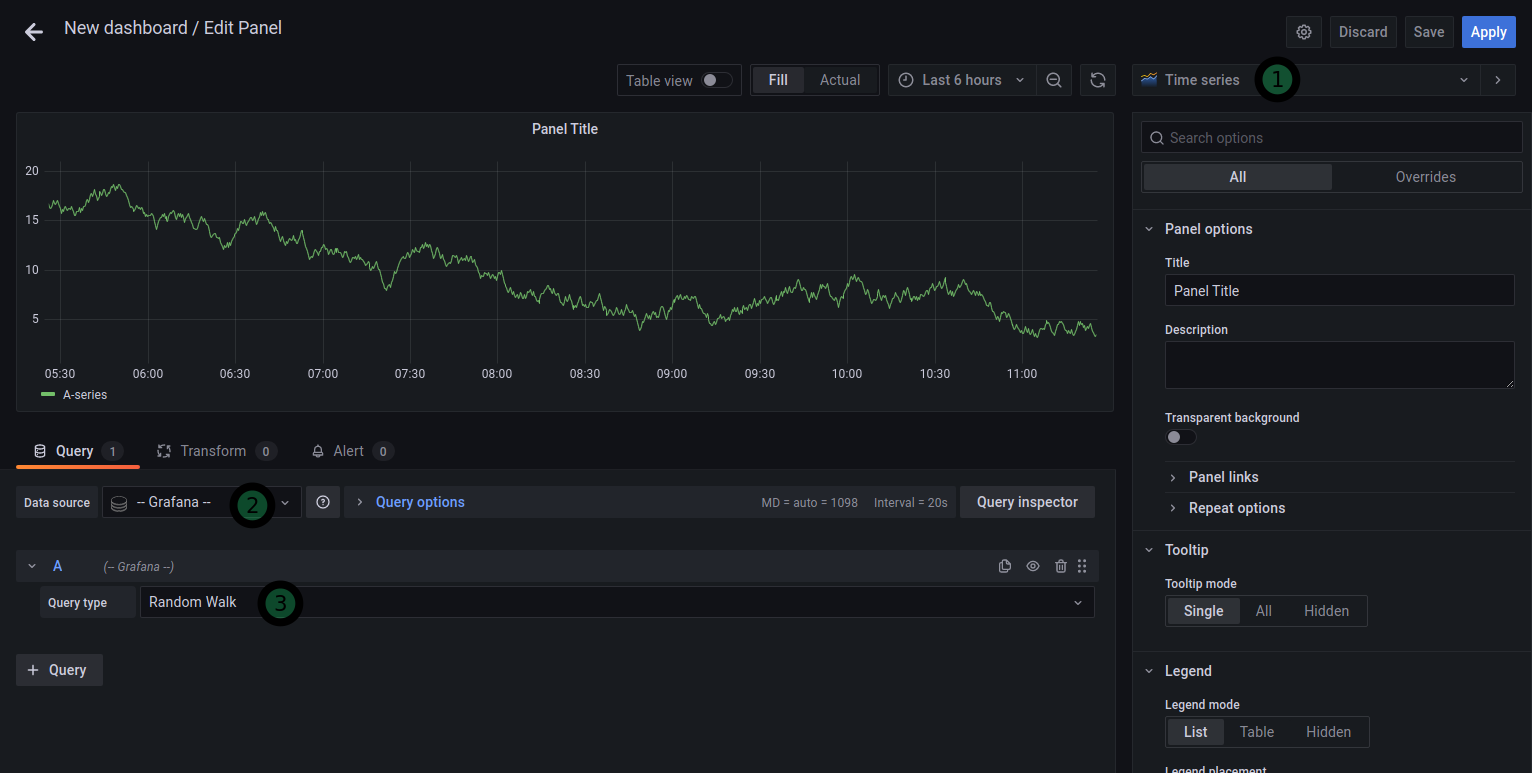
Here are a few examples…
To show the number of requests received per minute (for pods in the default namespace):
- type: time series
- query:
count_over_time({namespace="default"}[1m])
To show the number of login attempts per minute:
- type: time series
- query:
count_over_time({namespace="default"}|="POST /login"[1m])
To show the requests that caused a server error (code 5xx):
- type: logs
- query:
{namespace="default"}|~" 5.. "
This blog post is licensed under
CC BY-SA 4.0


