Security Onion : Getting started
May 23, 2020 by Thibault Debatty | 12536 views
Security Onion is a great tool that combines full packet capture, intrusion detection (snort and bro) and the elasticsearch-logstash-kibana (ELK) stack to store and visualize your security data. Let’s see how to get started…

Architecture
A default security onion setup consists of following sensors:
- full packet capture (with netsniff-ng)
- Snort IDS (you can also choose for Surricata)
- Bro IDS
- OSSEC HIDS
Packet captures (pcap files) are saved in /nsm/sensor_data/<hostname>-<interface>/dailylogs. They can also be visualized using the web app CapME.
Alerts from Snort, Bro and OSSEC are saved in an Elasticsearch database, where they can be visualized using Kibana.
Before you start
Security onion is actually meant to be installed on a desktop computer, thus with a complete desktop environment.
For this blog post, we take another way: we will install Security onion on a Ubuntu Server, using only a SSH connection to the server.
So you will need a server (physical or virtual) with:
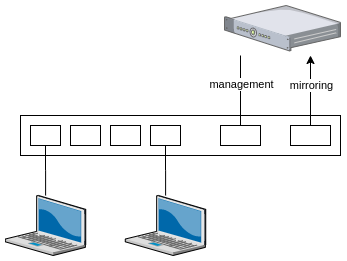
- 2 network interfaces: one interface for management (enp0s3 in our example) and one interface for sniffing (enp0s8 in our example)
- Ubuntu Server 16.04 installed
The sniffing interface will receive the network traffic that has to be analyzed, so it should be connected to the ‘mirroring’ port of a switch.
Installation
Configure MySQL not to prompt for root password (Setup will generate a random password later):
echo "debconf debconf/frontend select noninteractive"
    | sudo debconf-set-selections
Install Security Onion repository and packages
sudo apt-get -y install software-properties-common
sudo add-apt-repository -y ppa:securityonion/stable
sudo apt-get update
sudo apt-get -y install securityonion-all syslog-ng-core
Now you have to create the configuration file for installation, call it sosetup.con for example. You can download a model here.
The different configuration parameters are well documented, but here are the main elements you should absolutely modify:
- configuration of the management network interface (enp0s3 in our example)
- list of sniffing interfaces (enp0s8 in our example)
SGUIL_CLIENT_PASSWORD_1will be the password to use to connect to security onion
Now you can start the configuration:
sudo sosetup -f sosetup.conf
Your machine will reboot once, and after a few minutes, it should be ready to use…
Kibana
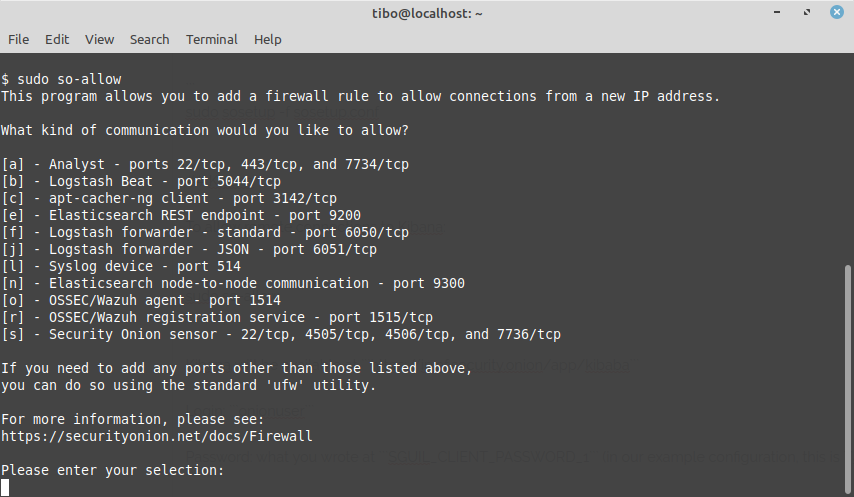
By default the integrated firewall will block all incoming connections. To allow remote connections to Kibana you must type sudo so-allow and select a in the menu.
Kibana will be available at https://ip.of.security.onion/app/kibana
- Login:
onionuser - Password: what you wrote at
SGUIL_CLIENT_PASSWORD_1(in our example configuration, this isasdfasdf
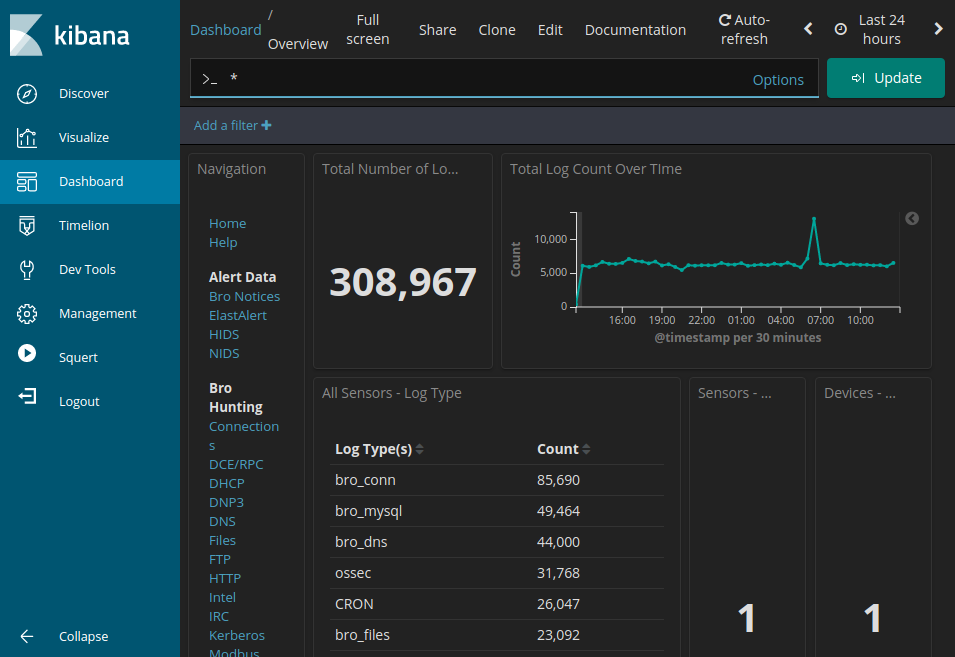
Dashboard
Kibana has multiple tabs on the left side. The main one is the dashboard, it show you statistics about your system: how many events are received, from wich ip’s etc.
Discover
The ‘Discover’ pane shows the list of recorded events, and it allows to perform queries.
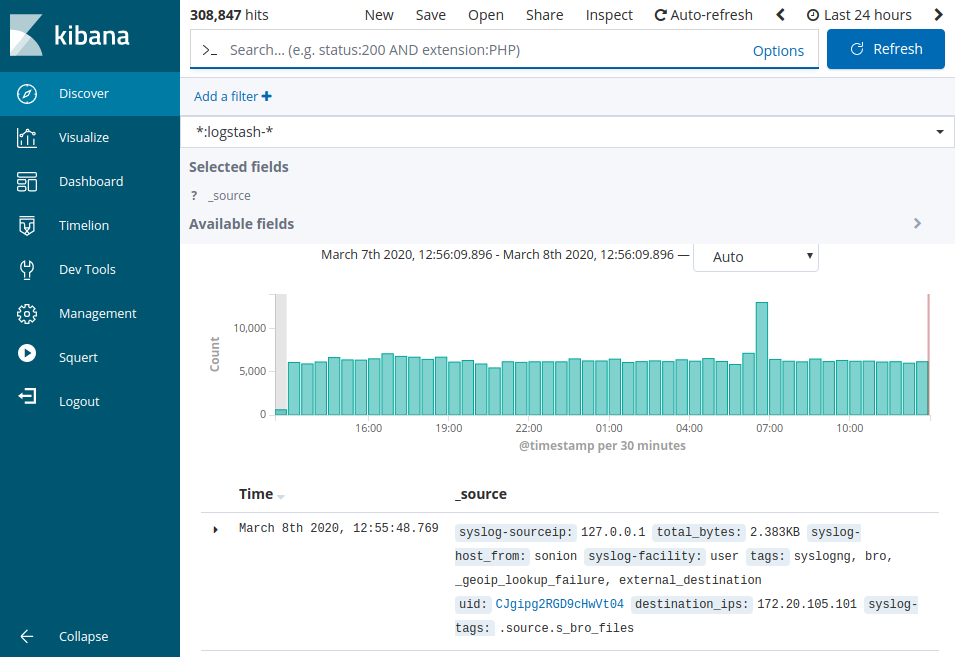
For example, you can try the following query in the top field: NOT event_type:ossec and click ‘Update’.
Once you are satisfied with your query, you can save it for later, using the Save button at the top.
Security onion comes with a lot of predefined search queries. You can load them (and you own saved queries) using the Open button at the top.
Visualize
The ‘Visualize’ pane allows to visualize counts, lists and event rates.
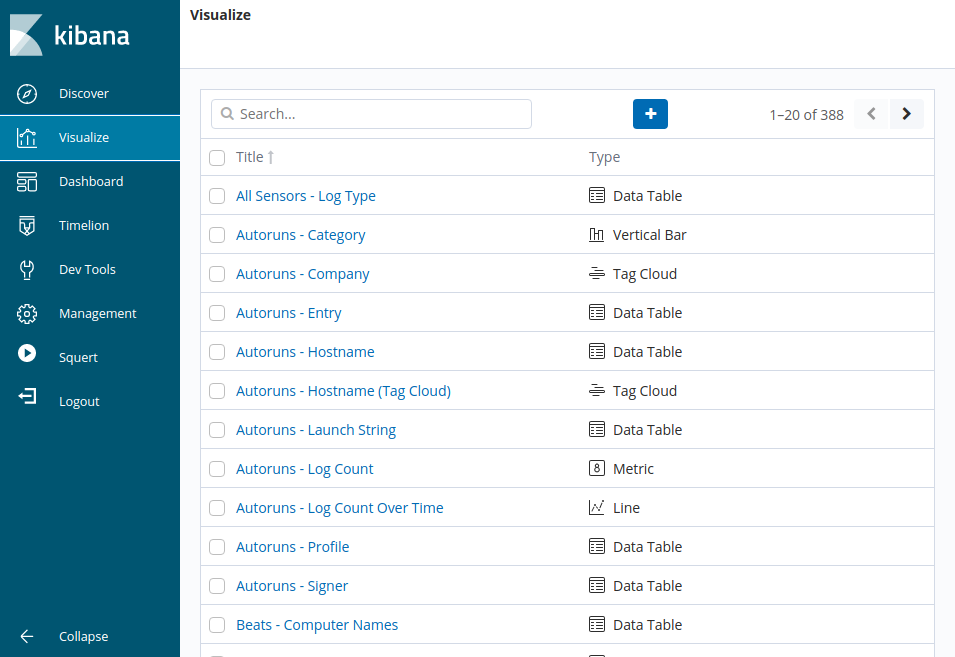
Once again, Security onion provides a lot of predefined graphs. You can also create your own graph, based on the search query that you saved previously…
This blog post is licensed under
CC BY-SA 4.0


